

Synergies Explained for ASX Investors: Spot Value and Avoid Hype
This article is for general information only and is not personal financial advice.
Synergies are the corporate world’s favourite magic trick.
A CEO buys another business. The deck gets dressed up. A few boxes move around on a slide. Then management says the magic word, synergies, and investors are meant to believe one plus one now equals three.
Usually, it does not.
Usually, one plus one equals two, minus integration costs, minus culture clashes, minus debt, minus a whole lot of management spin.
That’s the problem. Synergies are real, but the market treats them like they’re automatic.
They’re not.
They’re earned. And if you want to get better at spotting acquisitive winners on the ASX, you need a much sharper way of thinking about them.
Investors hear ‘earnings accretive’, ‘platform acquisition’, ‘cross-sell opportunity’, and ‘margin upside’, and they start imagining a beautifully integrated empire. What they often get instead is a slightly larger mess with a nicer investor presentation.
So let’s strip the nonsense out of it.
This is the practical investor’s guide to synergies. What they actually are. Which ones matter. Which ones are mostly fantasy. Where they show up in the accounts. How long they usually take. And how to tell whether management is building something repeatable or just feeding an acquisition habit.
What synergies actually are
In plain English, synergies are extra economic value that only exists because two businesses are combined.
For that reason, synergies are most commonly discussed during mergers, acquisitions, or internal restructures.
If the profit improvement would have happened anyway, it is not synergy. It is an operational turnaround, a cyclical tailwind, price rises, or management finally doing their job. Synergy is the benefit created by combination itself.
That sounds simple, but this single filter clears out a huge amount of rubbish.
If a company acquires a business and then the sector rebounds, that is not synergy. If management cuts obvious waste that should have been cut years ago, that is not pure synergy either. If earnings rise because commodity prices bounce, volumes recover, or interest rates fall, again, that is not synergy.
Real synergies come from putting two businesses together in a way that makes the combined group more efficient, more profitable, or less capital hungry than the two businesses would have been on their own.
That is the lens investors should use. Not the headline. Not the deck. Not the ‘strategic rationale’ page. Just this question.
If the deal never happened, would this benefit still exist?
If the answer is yes, management is selling you improvement and calling it synergy.
Types of synergies
Most synergy talk falls into four buckets: cost synergies, revenue synergies, capital synergies, and balance sheet synergies.
All four can exist. But they are not equally reliable.
Cost synergies and capital synergies are the ones you can usually underwrite with a straight face. Revenue synergies can happen, but they are where executives tend to get a bit drunk on their own PowerPoint. Balance sheet synergies can be useful, though they also create some of the dumbest excuses for overpaying.
We’re also going to touch on a fifth type – expertise synergies.
There are other variations you’ll hear, like distribution synergies, brand synergies, data synergies, or vertical integration. Most of these are really subcategories of the core types.
They can matter. Sometimes a lot.
But instead of memorising labels, focus on the underlying advantage being created. Is it lowering costs, improving capital efficiency, enhancing capability, or expanding reach?
That’s what actually drives value.
Let’s dive in.
Cost synergies: boring, beautiful, bankable
Cost synergies are the ones investors should love most, precisely because they sound the least exciting.
Duplicate head office roles get removed. Procurement gets cheaper. Warehousing gets consolidated. Freight gets optimised. IT systems get standardised. Back-office functions get folded together. In industrial businesses, plant utilisation can improve and unit costs can fall.
None of this is sexy. That is exactly why it matters.
Real investing edge often sits in the boring stuff. Everyone wants the transformational growth story. Fewer people want to get excited about shared distribution, centralised purchasing, or finance teams being merged. But that is often where the real money is made.
Cost synergies are also easier to track.
If they are real, they should eventually show up in gross margin, operating expense ratios, and cash generation. Procurement savings can lift gross margin. Overhead absorption should reduce operating costs as a percentage of revenue. Cleaner systems and tighter execution often improve working capital and cash conversion too.
That is why cost synergies tend to be the most credible. They rely less on customer behaviour and more on management execution. It’s about removing duplication and running the business better.
That’s still hard.
But it’s more believable than the usual fantasy that every customer across the group will suddenly want to buy six more products because the company made an acquisition.
For cost synergies, pay attention to gross margin, net margin, and operating costs as a percentage of revenue.
Revenue synergies: seductive and dangerous
Revenue synergies are where corporate optimism goes to do lines in the bathroom.
On paper, they sound fantastic. Cross-sell the customer base. Bundle the products. Enter new geographies. Use one distribution network to push multiple brands. Increase wallet share. Expand into adjacent categories.
Sure. Maybe.
The problem is that revenue synergies depend on human behaviour. Sales teams defend turf. Customers buy based on their own needs, not because the board approved a transaction. Product-market fit does not automatically transfer.
Brands can clash. Channels can conflict. Incentives can misalign.
The ‘obvious’ upside is often far from certain.
That’s why smart investors treat revenue synergies as upside, not as the core reason to back a deal.
If an acquisition only makes sense because management is promising heroic cross-selling gains, be careful. Very careful. That is often code for ‘the numbers do not really work yet, but trust us’.
The better setup is when a deal already works on cost discipline, margin repair, procurement leverage, or asset utilisation, and the revenue synergy angle is a bonus if it comes through.
This isn’t to say that revenue synergies never work. When they do work, they can be majestic. But approach with caution.
Revenue growth in percentage terms is the main metric to measure revenue synergy.
Capital synergies: the hidden compounding machine
This is the category investors underrate.
Capital synergies happen when the combined group needs less capital to generate the same earnings, or can deploy capital more effectively because the platform is bigger and better integrated.
This is where the best acquirers quietly separate themselves from the pack.
Fleet can be shared. Warehouses can be used more efficiently. Corporate infrastructure can support more revenue without proportional reinvestment. Systems do not need to be rebuilt from scratch in each business unit. Distribution networks can be leveraged across a broader base. Cash can be redirected into the highest-return parts of the portfolio instead of being trapped in weaker divisions.
This is powerful because capital discipline compounds.
A company that improves return on invested capital while still growing has a very different future to one that grows by bolting on more assets and chewing through fresh capital every year.
One becomes a self-reinforcing machine. The other will stick its hand out for investor funds every time it needs to buy a new distribution channel.
Capital synergies rarely get the same hype as revenue synergies, but for long-term investors they can be far more valuable. They improve the quality of growth. They reduce strain on the balance sheet. They create more strategic flexibility.
In the accounts, look at capex intensity, depreciation relative to revenue, asset turns, and return measures where disclosed. You are trying to see whether the combined platform is becoming more productive, not just bigger.
Bigger is easy. Better is rarer.
Return on Capital Employed (ROCE) and Return on Equity (ROE) are key metrics to watch here.
Balance sheet synergies: useful, but easy to abuse
These are the synergies management teams love citing when they want to justify doing one more deal.
Cheaper funding. Better banking relationships. Tax assets. Covenant headroom. More negotiating leverage with suppliers. Improved scale with lenders.
Some of this is real. A larger and more diversified group can absolutely improve its funding profile or purchasing power.
But balance sheet synergies are often where discipline starts to wobble.
Because once management convinces itself that the combined group has a stronger balance sheet, the temptation is to use that ‘strength’ to load up on even more leverage and chase even more acquisitions.
At that point the balance sheet is no longer a source of resilience. It becomes a delivery mechanism for future pain.
So yes, balance sheet synergies can work. Just don’t let management use them as a substitute for operating performance.
A better debt package is not the same thing as a better business.
The best metrics to watch here are average interest rates, as well as cost and quality of funding access.
Expertise synergies: when capability is the asset
Expertise synergies are not about cutting costs or sharing assets. They are about combining different types of know-how to create something that neither business could have built alone.
That sounds obvious. It is not.
Because unlike cost or capital synergies, expertise synergies do not show up cleanly in a spreadsheet on day one. There is no immediate margin bridge. No obvious overhead reduction. No neat procurement saving. What you are really betting on is capability transfer.
And that is where things get interesting.
Think of it like this. One business knows how to build the product. The other knows how to deliver the experience. On their own, both are limited. Together, they can create something new that is more valuable than either starting point.
That is the theory.
In practice, this is one of the hardest types of synergy to execute. But when it works, it can be far more powerful than simple cost cutting.
Expertise synergies show up in new products, improved processes, shifts in product mix, access to new regions or customer segments, and better customer experience.
In other words, it’s improved-decision making and business function. Hard to pin down, but you’ll know it when you see it.
Think about these questions when looking at expertise synergies:
- Does each business bring a genuinely different capability?
- Is there a clear mechanism for combining them?
- Is there evidence the combined system is producing better outcomes?
Why investors keep misunderstanding synergies
Part of the issue is that markets lump very different things together.
A cyclical recovery gets called synergy. Basic cost-cutting gets called synergy. A management turnaround gets called synergy. A sector tailwind gets called synergy. Suddenly every improvement post-deal is swept into one neat narrative.
That is dangerous because it stops investors from asking the harder question.
What exactly is changing here, and why?
The best way to analyse synergies is to break them into pieces and map each piece to a line item.
Improved procurement should boost gross margins. Removing overhead duplication improves operating expense ratios. If working capital is tightened, cash conversion should strengthen. A more productive network, leads to better capital intensity.
Once you do that, the story becomes much harder to fake.
That is how to think about synergies. Not as a vague cloud of future goodness, but as a set of specific and measurable financial consequences.
The integration curve
Real synergies do not usually arrive in a neat straight line.
The first six months can be messy.
Management attention gets stretched. Systems do not talk to each other. Staff leave. Customers get confused. One-off costs hit. Inventories can swell. Working capital gets noisy. Reported numbers can even look worse before they look better.
That does not automatically mean the deal is failing.
But there needs to be a roadmap. Investors should be able to understand the end state management is aiming for, the milestones on the path, and the evidence that the numbers are at least starting to move in the same direction as the story.
Generally, you want to see tangible signs within 12 to 24 months. Not necessarily the full prize, but enough proof that integration is doing what management said it would do.
If all you get is endless ‘transformation’ language, recurring ‘one-off’ costs, and moving targets around the synergy timeline, you are probably not looking at a master integrator. You are looking at a company hiding behind jargon while the bill gets bigger.
How to spot a genuine integrator
The best acquirers are usually less flashy than the market expects.
They buy in adjacent lanes. They keep the people who matter. They standardise systems early. They use consistent language around synergy targets. They reconcile the numbers clearly. They do not rely on heroic assumptions. They don’t tell you every deal is ‘transformational’.
And they tend to repeat themselves.
That is a huge tell.
If a management team has a repeatable formula, you should be able to see the same pattern across multiple deals. Similar logic. Similar integration playbook. Similar financial benefits. Similar timing. Similar disclosures.
That repeatability matters far more than charisma.
Here are the green flags. Deal sizes the company can actually digest. Synergy claims tied to line items. Integration milestones that later get reported against. Improving gross margins or cost ratios in the acquired operations. Better cash conversion over time. A clear tilt toward the highest-return parts of the group.
Now the red flags. Constantly changing definitions of ‘underlying’ earnings. Big revenue synergy promises doing all the heavy lifting. Endless restructuring costs. Debt growing faster than cash earnings. Working capital blowing out. Management talking more about adjusted numbers than reported reality. Directors selling stock while preaching long-term upside.
None of these alone prove disaster. But watch for patterns.
The best integrators make acquisition look boring. The worst ones make it sound visionary.
Nick Scali (ASX:NCK) and the management transplant model
A clean example of synergy thinking comes from Nick Scali (ASX:NCK).
Nick Scali had already built a strong furniture retail model in ANZ. Then it acquired a smaller UK platform that had been scraping by. The opportunity was not some abstract ‘strategic fit’. It was brutally concrete. Better product. Better sourcing. Better merchandising. Better logistics. Better overhead control. Better execution.
In other words, the acquired asset was not valuable because of what it was. It was valuable because of what the Nick Scali playbook could turn it into.
That is one of the most important synergy concepts investors can learn.
Sometimes the synergy is not between two equal businesses. Sometimes it comes from a superior operator taking over an inferior operating system and replacing it. Management quality itself becomes the synergy.
That is the kind of angle markets often underappreciate early.
Nick Scali framed the Australian furniture market at about $12.4 billion and the UK market at about $24.3 billion. The prize was bigger. The starting footprint was tiny. That creates an attractive setup because the upside comes mostly from execution.
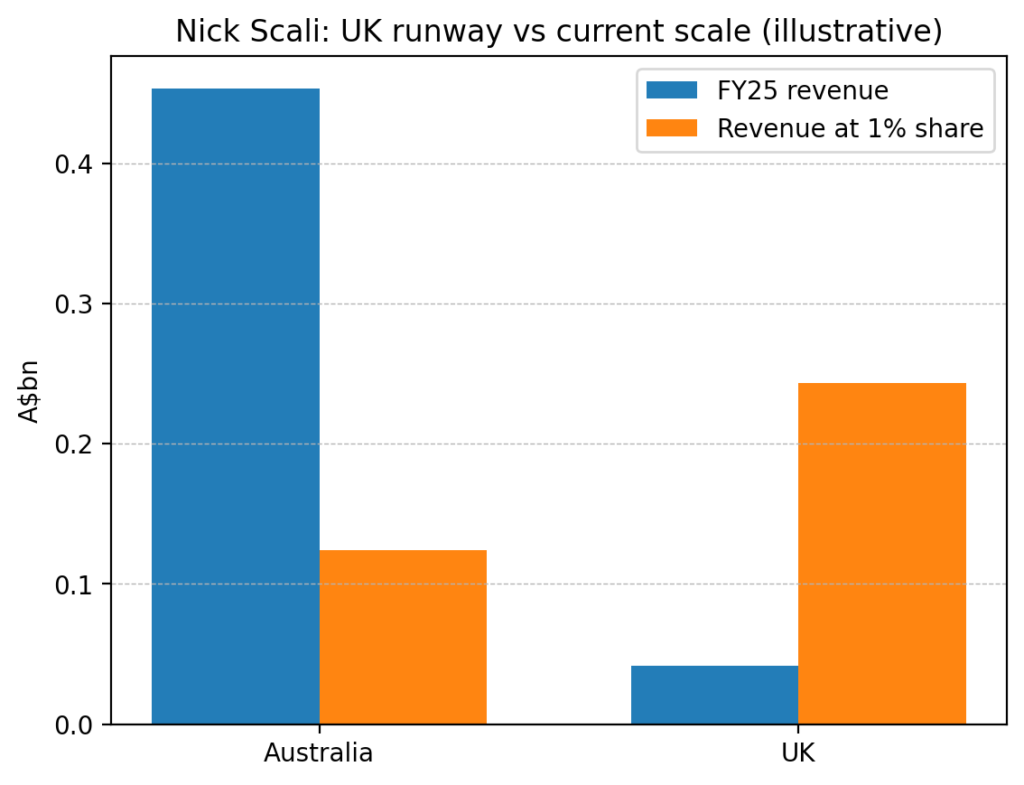
In FY25, ANZ revenue was $453.5 million and UK revenue was $41.8 million. That gap is the whole story. Nick Scali already had real scale in its home market, while the UK was still small enough to reshape without needing miracles.
Then came the margin gap.
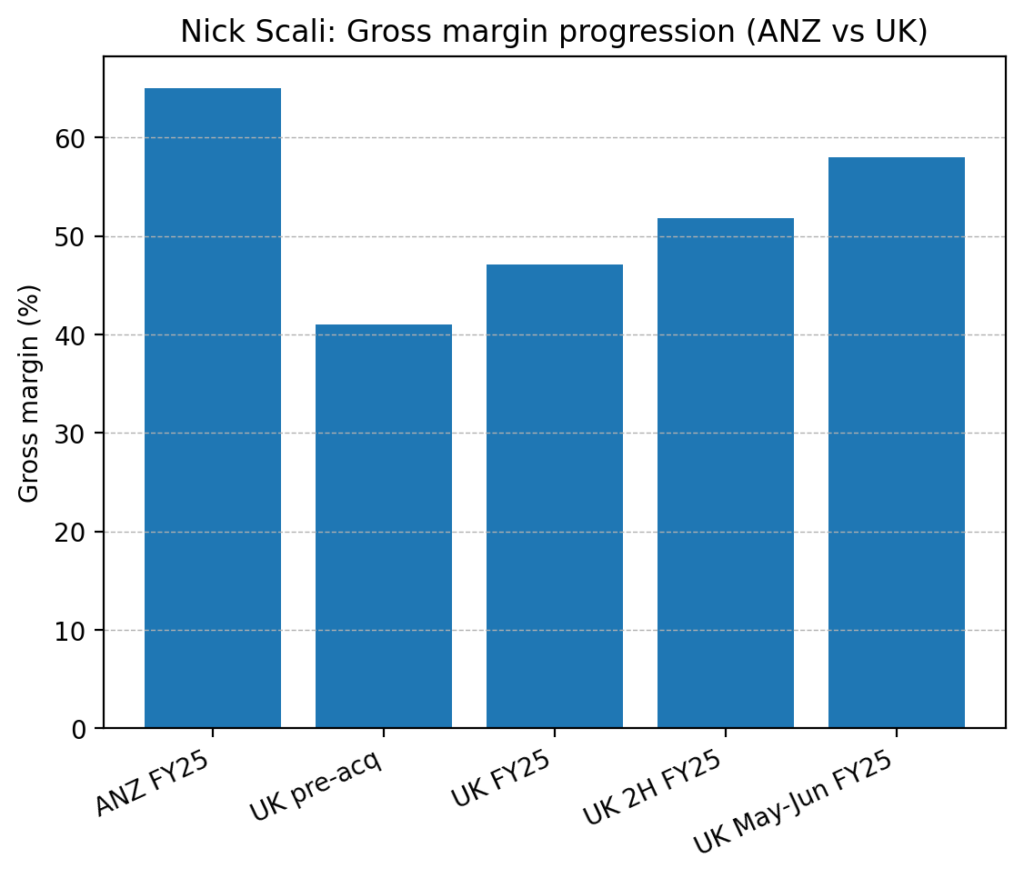
ANZ gross margin was 65.0%. UK gross margin was 47.1%. That’s a big opportunity.
Same category. Same operator. Very different economics. The acquired platform had plenty of room to improve before anyone even starts talking about big sales growth.
And the margin bridge started to prove it.
The UK gross margin in the first half was 45.1%, up from 41.0% pre-acquisition, then lifted to 51.8% in the second half as Nick Scali product deliveries began. Rebranded stores in May and June ran at 58% gross margin.
You can do the simple maths from there.
On UK revenue of $41.8 million, a lift from 47.1% to 58% gross margin would add about $4.6 million of gross profit without selling a single extra couch. Push that toward ANZ-style margin levels and the uplift gets even larger.
Synergy.
Measurable synergy.
Final word
Synergies can be powerful. But they’re routinely exaggerated, and often misunderstood.
They should be treated like a forensic exercise and not a magical spell.
Real synergies are specific, measurable and tied to line items. They usually come from cost discipline, capital efficiency, or management capability.
They take time.
They require integration skill. And they are easiest to trust when the deal already makes sense without heroic revenue assumptions.
Management will almost say there are synergies.
Be skeptical.
Ask what kind.
Where will they show up? How long will it take?
Has the team done it before? Is the business genuinely becoming better, or just temporarily becoming bigger?
Bigger businesses get applause and attention.
Better businesses make money.
Check out this Maas Group synergies case study. The company has turned synergistic acquisition into a master class.
This publication has been prepared by The Markets IQ, a division of Vitti Capital Pty Ltd (ABN 13 670 030 145), which is a Corporate Authorised Representative (001306367) of Point Capital Group Pty Ltd (ABN 41 625 931 900), the holder of Australian Financial Services Licence 518031. This report is for general information only and does not take into account your objectives, financial situation, or needs. It is not personal financial advice or a recommendation to buy, hold, or sell any security. You should consider whether the information is appropriate in light of your circumstances and obtain professional advice before making any investment decision. This report is intended solely for wholesale, sophisticated, or professional investors within the meaning of the Corporations Act 2001 (Cth).
Any views, probabilities, valuations, technical levels, or forecasts expressed are strictly the opinions of the authors as at the date of publication, based on publicly available information and assumptions which may change without notice. They are illustrative only and not predictive of future outcomes. Past performance is not a reliable indicator of future performance.
Directors, staff, or clients of Vitti Capital may hold positions in Maas Group (ASX:MGH) or related securities at the time of publication. Such holdings may change without notice. Vitti Capital applies internal controls to manage potential conflicts of interest; however, readers should assume that conflicts may exist.