

The Dangerous Change Unfolding For Dividend Stocks
And two names with a possible solution
This article is for general information only and is not personal financial advice.
Two weeks ago I told you the market had already priced your mortgage rise.
On 29 September the Reserve Bank delivered it. The cash rate went to 4.60%. That’s the fourth hike this year and the highest cash rate since late 2011.
And the RBA didn’t close the door. It said it’ll do what it takes, ‘including increasing the cash rate target further if needed.’
That should be heard as a warning shot to anyone holding an income portfolio built on bond proxies.
The Income Trap In A Rising-Rate World
Bond traders still call 1994 the Great Bond Massacre. The US Federal Reserve doubled its cash rate in twelve months and about US$1.5 trillion of bond value went up in smoke. Plenty of the people holding ‘safe’ bond funds found out what a rate shock does to capital.
The same trap is open today.
When you want dividend stocks for passive income, the reflex is to reach for the bond proxies.
The REIT. The fixed-rate bond fund. The long-duration listed trust.
They pay a fat, steady distribution, and they all sit on the same spring. When long yields rise, the market discounts their future cash harder, and the unit price falls in sympathy with bond prices.
You collect the distribution and hand back the capital.
In May we told you boring old REITs would come back into vogue as the budget pushed money from growth into yield. We also warned that rate rises would squeeze their bottom line. That squeeze is here.
So where do you hide?
In businesses that can lift their own income. Today, two of them. A tap maker that put its prices up 5% in August, and a broker that more than doubled its earnings per share.
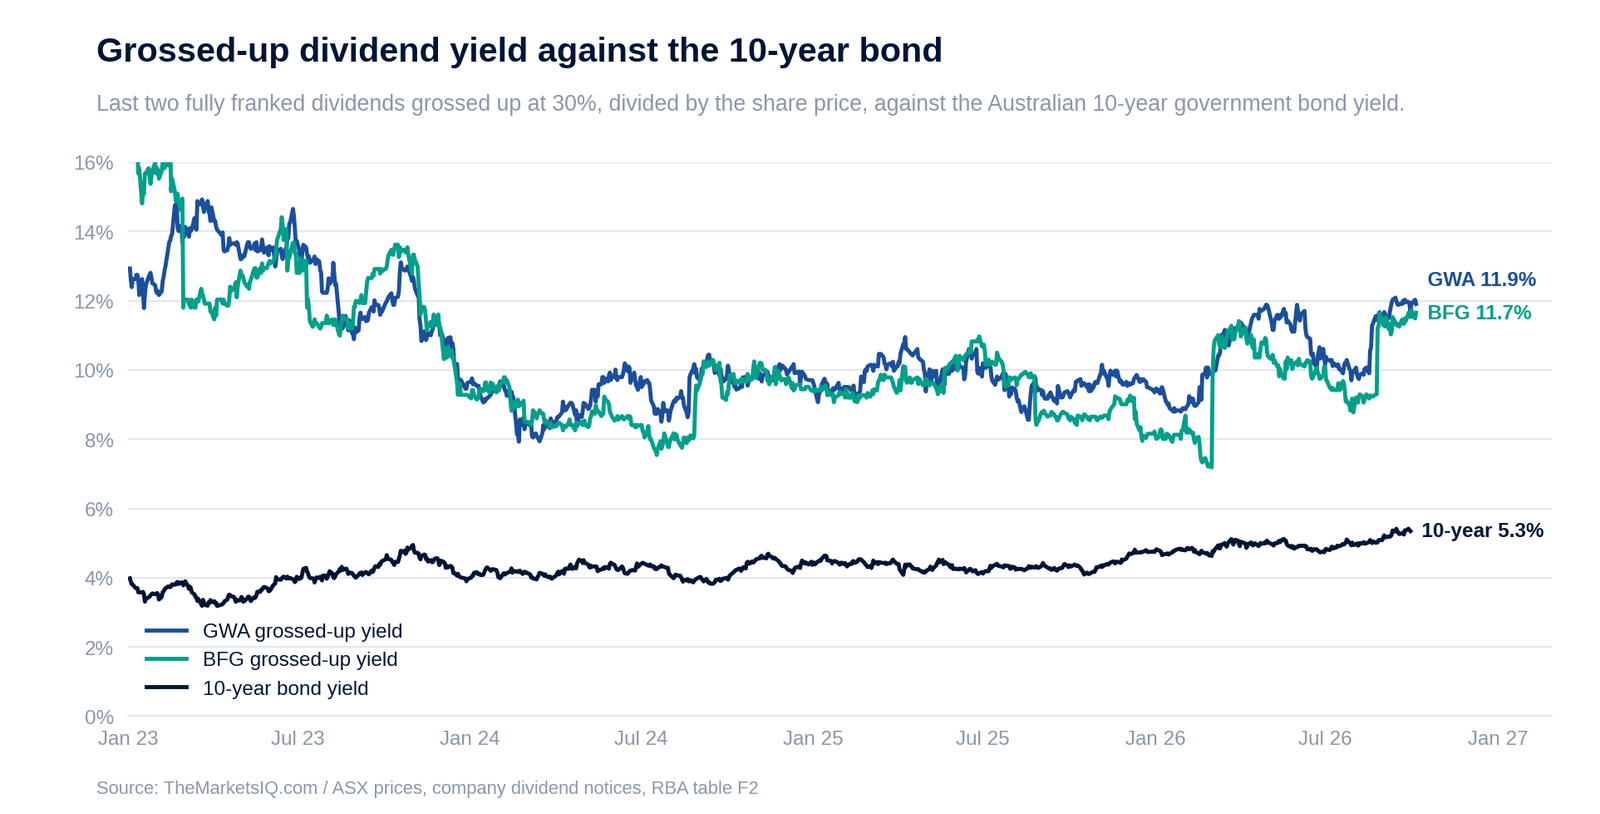
Both pay fully franked dividends. Grossed up for franking, GWA yields 11.9% and Bell 11.7%, about 6-7% above the 10-year government bond.
Both score highly on The Markets IQ inhouse screens. Since 2023, the ASX stocks that score best on our screens have fallen about half as far in their worst stretches as the ones that score worst.
| Stock | Market cap | Latest result | NPAT (growth) | Dividend (fully franked) | Grossed-up yield | Next catalyst |
|---|---|---|---|---|---|---|
| GWA Group (ASX:GWA) | $504m | FY26 | $48.0m (+10.6%) | 16.5c FY, up 6.5% | 11.9% | AGM, 30 Oct 2026 |
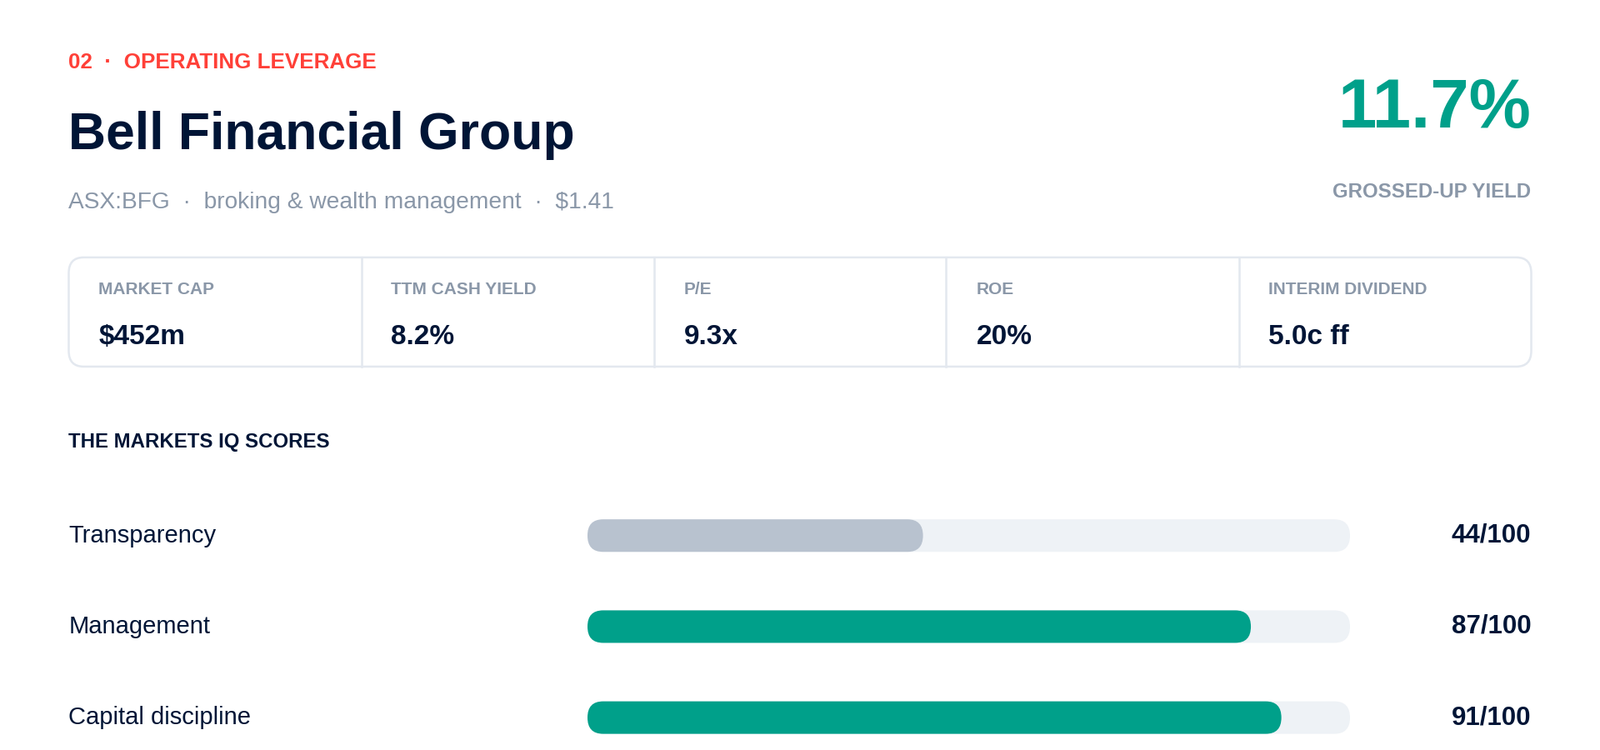
| Bell Financial Group (ASX:BFG) | $452m | 1H26 | $21.7m (+132%) | 5.0c interim, up from 3.0c | 11.7% (TTM) | Profit update, Dec-Jan (expected) |
(Source: TheMarketsIQ.com / ASX announcements and company filings)
GWA’s figures are for the year to 30 June 2026. Bell’s are for the six months to 30 June 2026. Yields use dividends actually paid in the last 12 months. Prices and yields are at the close on 6 October 2026, grossed up at the 30% company tax rate.
The first company supplies products that are likely in your bathroom right now.
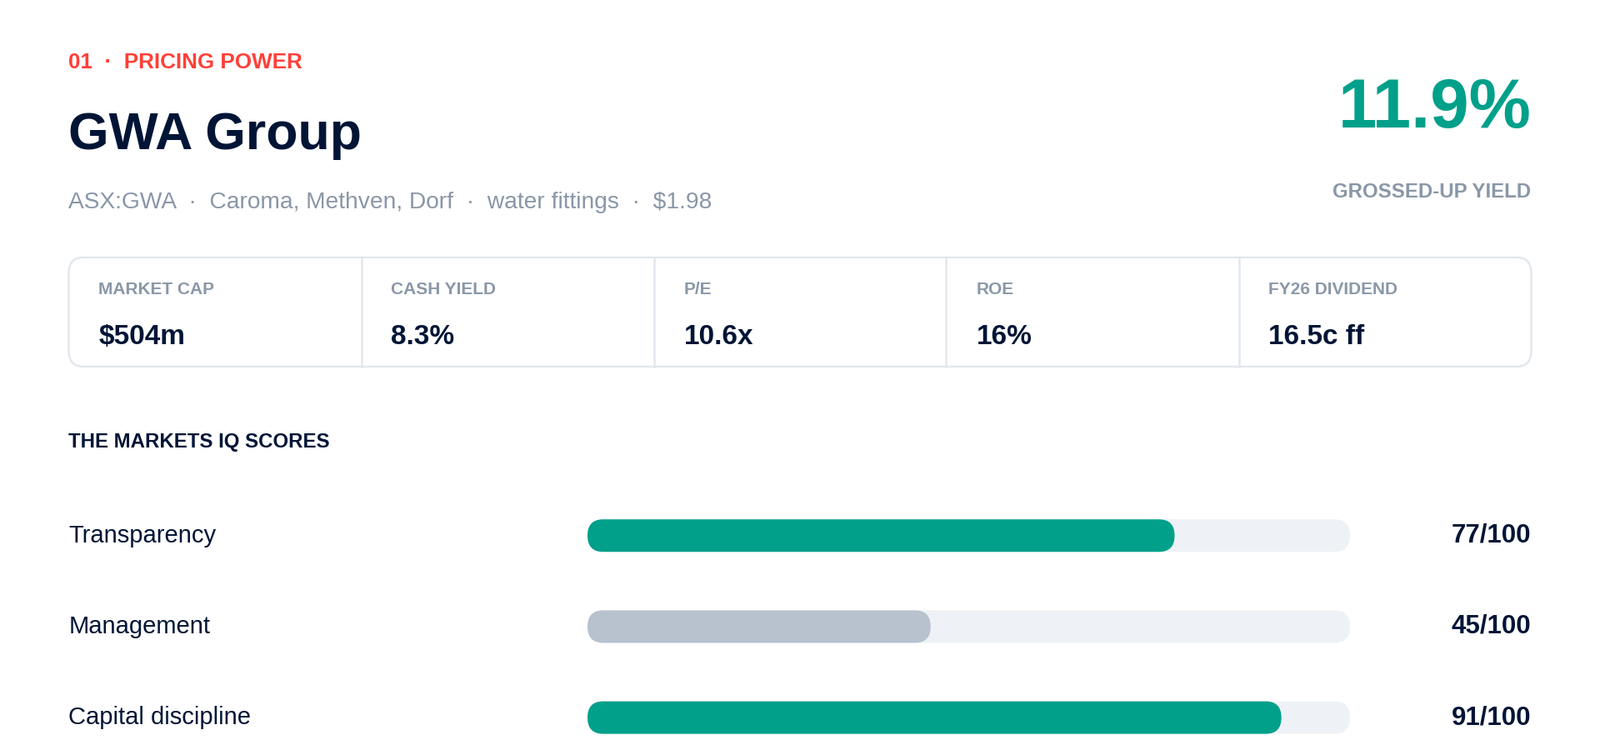
GWA Group (ASX:GWA), The Tap Maker That Just Raised Its Prices
Next catalyst: the annual general meeting on Friday 30 October 2026. GWA used its last two AGMs to update the market on first-quarter trading, so this is the first read on whether the August price rise has stuck.
GWA Group (ASX:GWA) makes the tap you turned on this morning.
It owns Caroma, Methven and Dorf. Toilets, basins, tapware and the fittings behind the wall. Dull, essential, and bought again whether or not anyone is building.
Here’s a bit of trivia. Caroma developed the two-button dual-flush toilet in 1980. Australia’s water rules have tightened ever since, and Caroma has spent 46 years on the right side of them.
This is a pricing-power business wearing a cyclical costume.
In FY26, with home building flat on its back, GWA still lifted volumes in Australia, New Zealand and the UK. Revenue rose 0.9% to $422.3m, and statutory net profit rose 10.6% to $48.0m. Then, on 1 August, it put Australian prices up about 5%. New Zealand gets about 4% from 1 November.
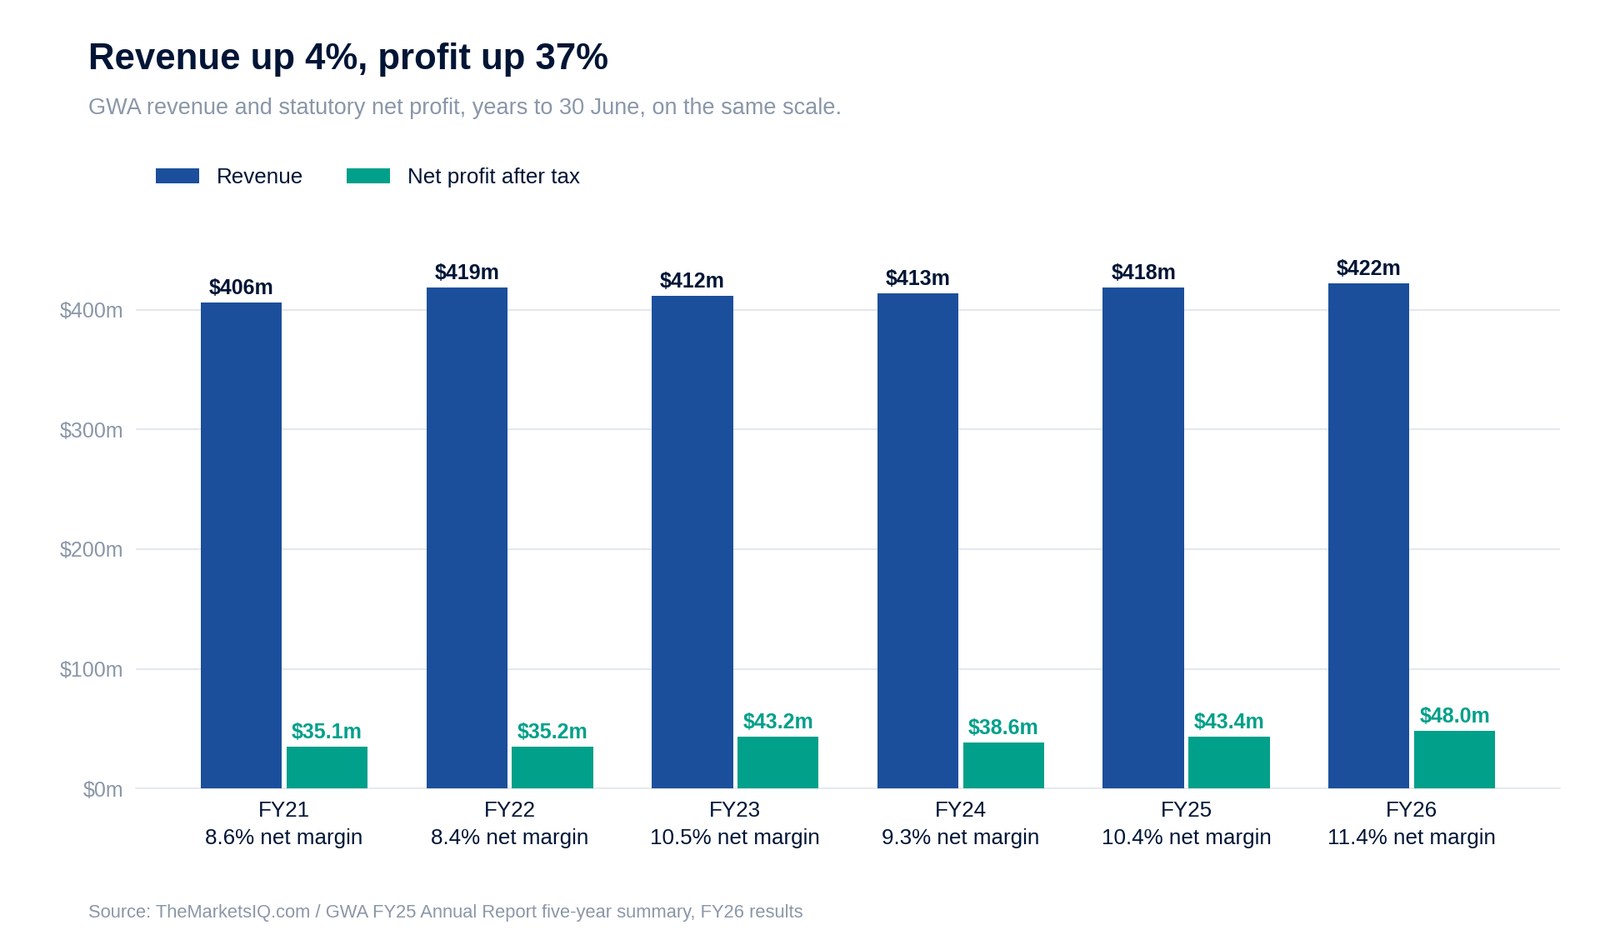
Go back five years and the pattern holds. Revenue is up 4%. Net profit is up 37%. The net margin has climbed from 8.6% to 11.4%.
In January we told you companies with strong pricing power do well when inflation runs. GWA is a fine example of pricing power in action. It’s a price maker, not a price taker.
Where The Margin Comes From
Chief executive Urs Meyerhans puts it down to discipline.
‘Operational and cost discipline lifted Group normalised EBIT by 2.5% and improved margin, despite challenging market conditions.’
Urs Meyerhans, GWA chief executive
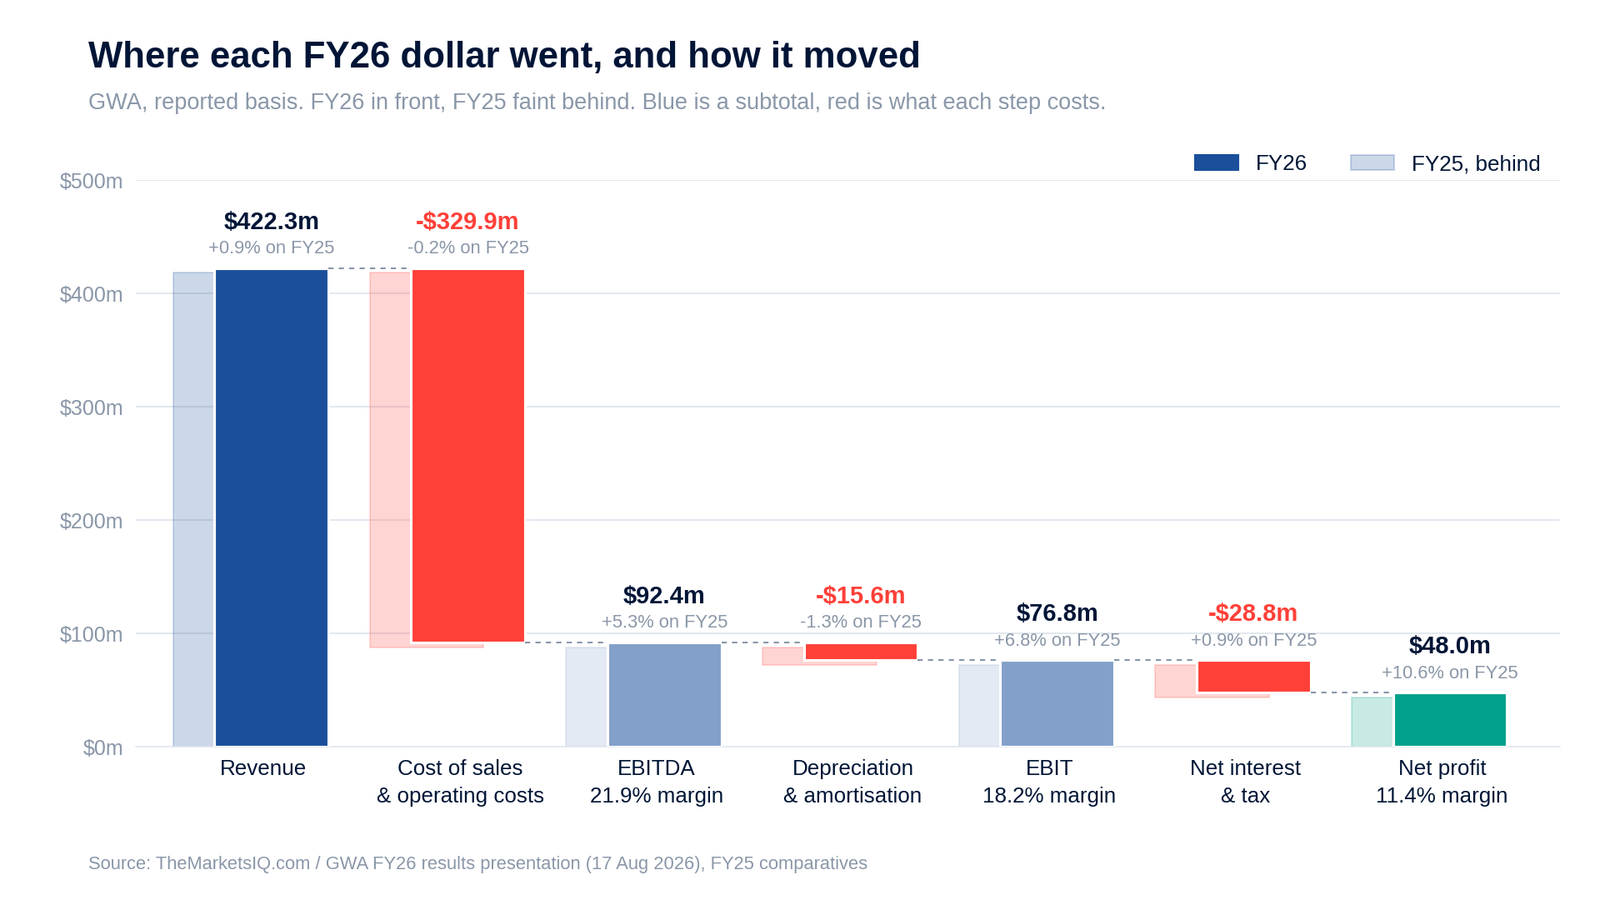
Hold FY26 up against FY25 and you can see it. Revenue rose 0.9%. Cost of sales and operating costs fell 0.2% to $329.9m.
That small gap does all the work. EBITDA rose 5.3%, EBIT rose 6.8% and net profit rose 10.6% to $48.0m.
The board lifted the full-year dividend 6.5% to 16.5 cents, fully franked. At $1.98 that’s an 8.3% cash yield, or 11.9% grossed up, on about 10.6 times earnings.
What The Building Data Says
About 59% of GWA’s Australian revenue comes from repair and renovation. So start with renovations.
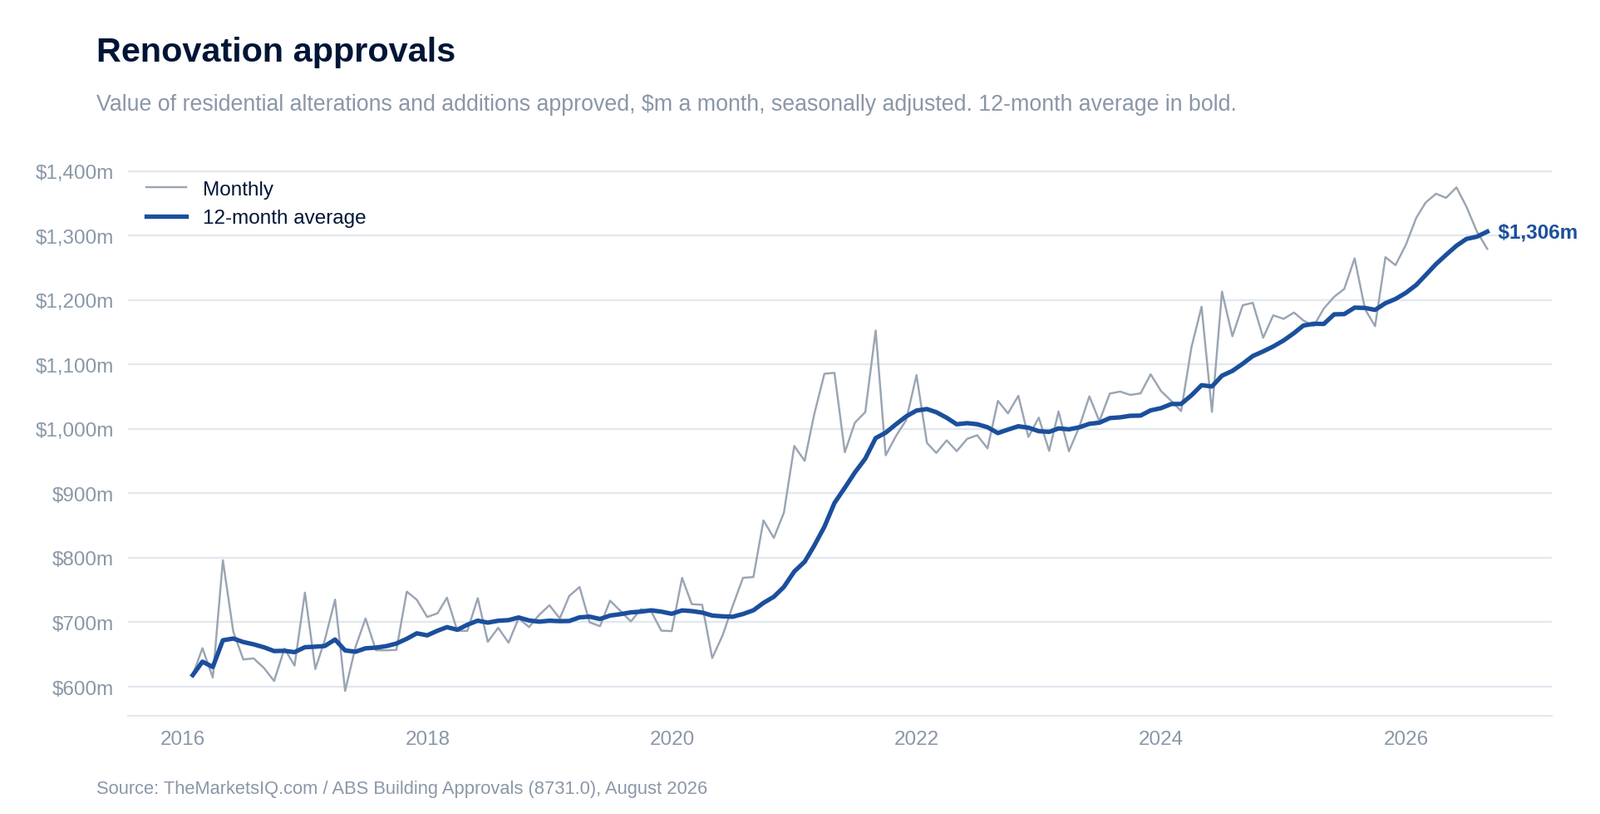
Approvals for renovation work are running at $1.31bn a month on a 12-month average. That’s the highest since at least 2016, and up 28% in three years.
Some of that is inflation. So check the real volume, with price rises stripped out.
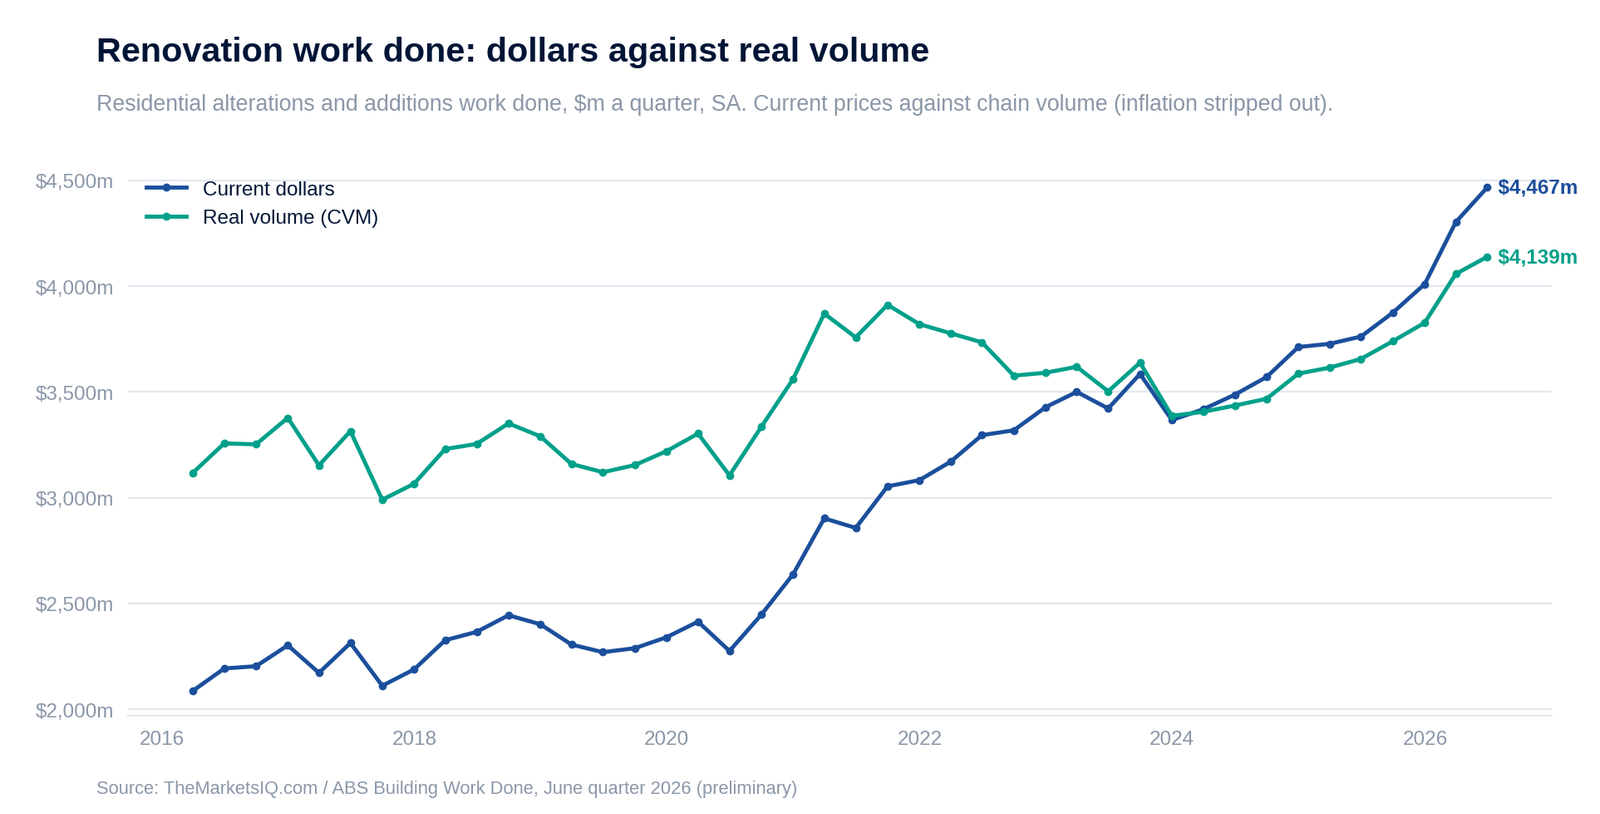
Real renovation work done hit $4.14bn in the June quarter, also the highest since at least 2016. It’s up 18% in three years. So the growth is in real work, as well as in prices.
New building is a weaker picture.
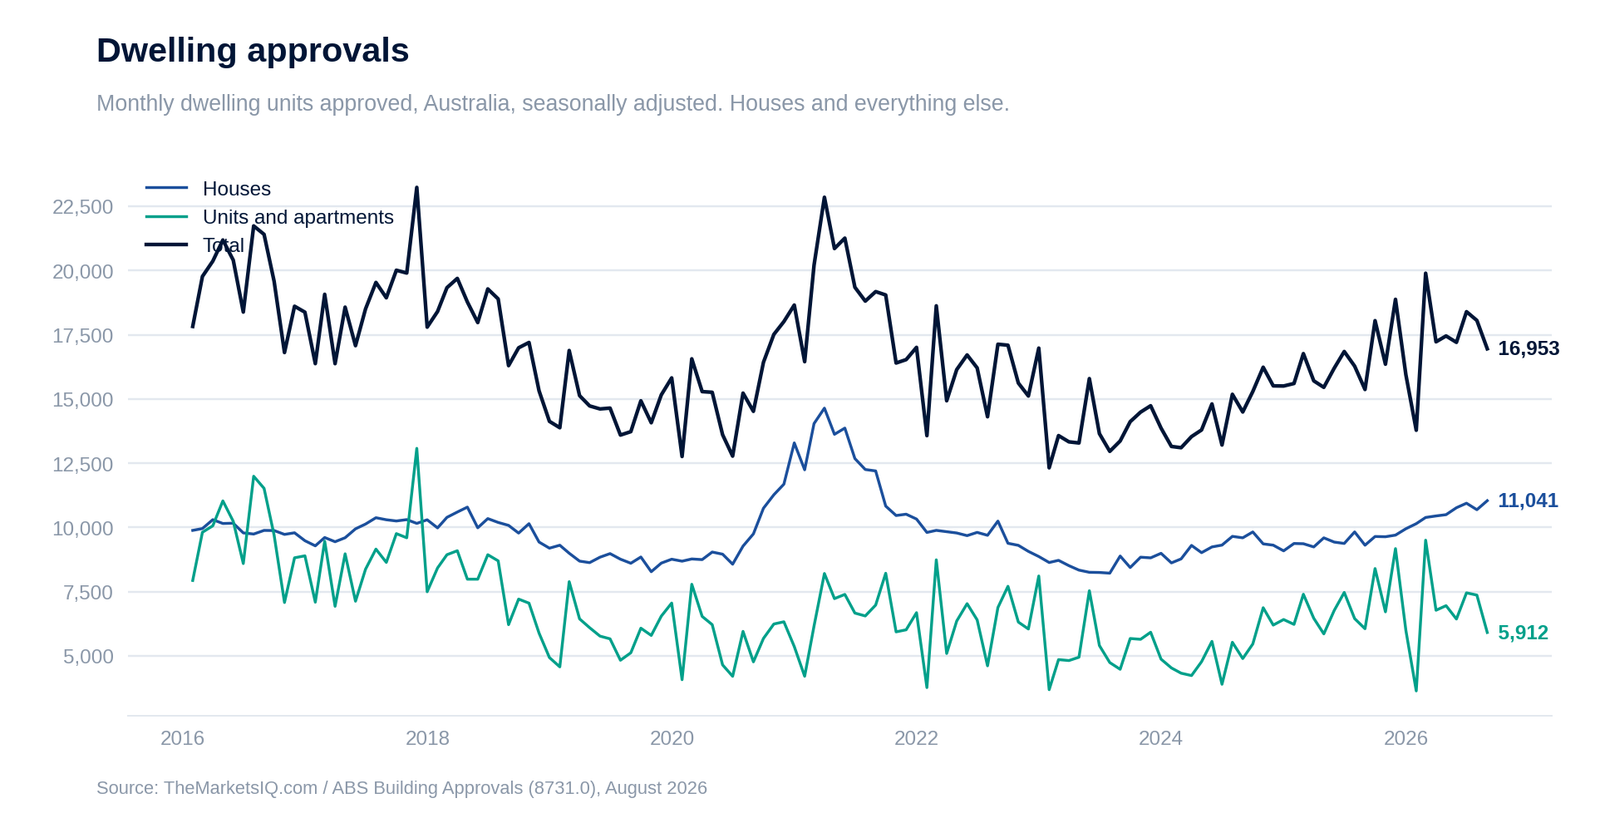
House approvals have climbed 15% in two years to 11,041 in August. Apartments are still soft.
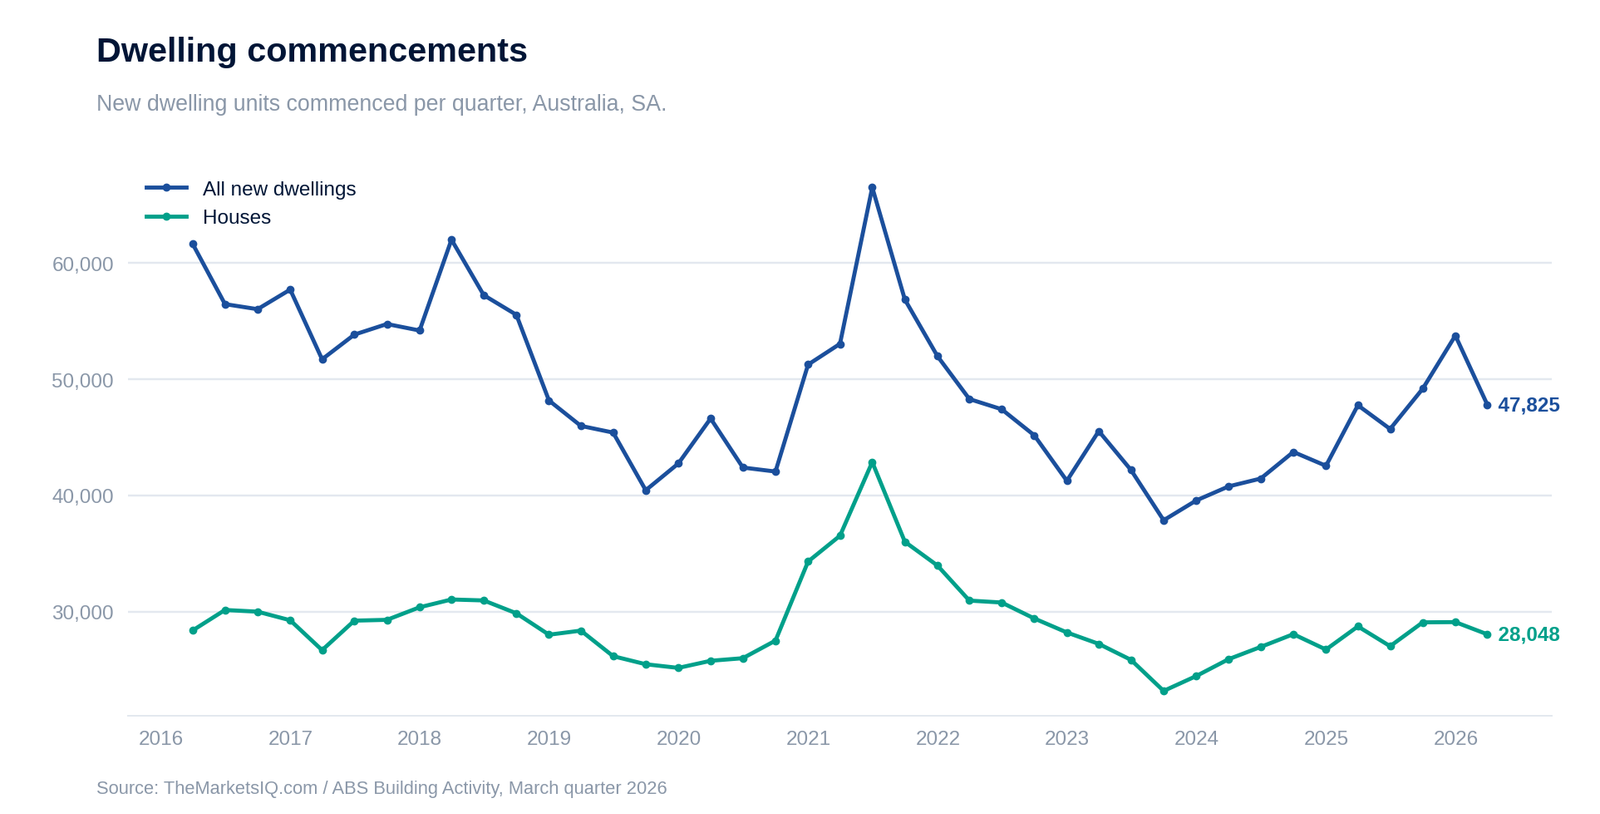
And dwellings started fell 11% in the March quarter to 47,825. That matches GWA’s own caution. Renovation is the stronger half of its market.
Why The Plumber Keeps Coming Back
GWA’s moat is habit. Plumbers and builders tend to stick with brands they know, and a cistern gets chosen once and stays in the wall for years.
GWA works that habit hard. Its ‘Win the Plumber’ program ran more than 30,000 technical interactions with plumbers in FY26, up from 26,000.
Management’s medium-term line is plain.
‘The Group will also continue to leverage its strong customer relationships, service proposition and leading brands to drive sustainable growth and enhanced shareholder returns over the medium term.’
GWA FY26 managing director’s review
The Risk Management Is Flagging
GWA doesn’t sugar-coat FY27. Its own remuneration report puts it bluntly.
‘FY27 is expected to be a challenging year where GWA’s overall addressable market is expected to decline, however the Executive KMP have developed strategies to specifically target market segments that will provide maximum return to shareholders.’
GWA FY26 remuneration report
Australian sales fell 2% in the second half compared with the first. UK repair and renovation is expected to contract through FY27, and ocean freight adds $3m to $4m in costs.
The dividend also takes about 88% of normalised earnings of 18.7 cents a share. That’s a thin cushion if the slowdown bites harder than management expects.
Watch the price rises. If they stick while volumes hold, the margin story keeps running.
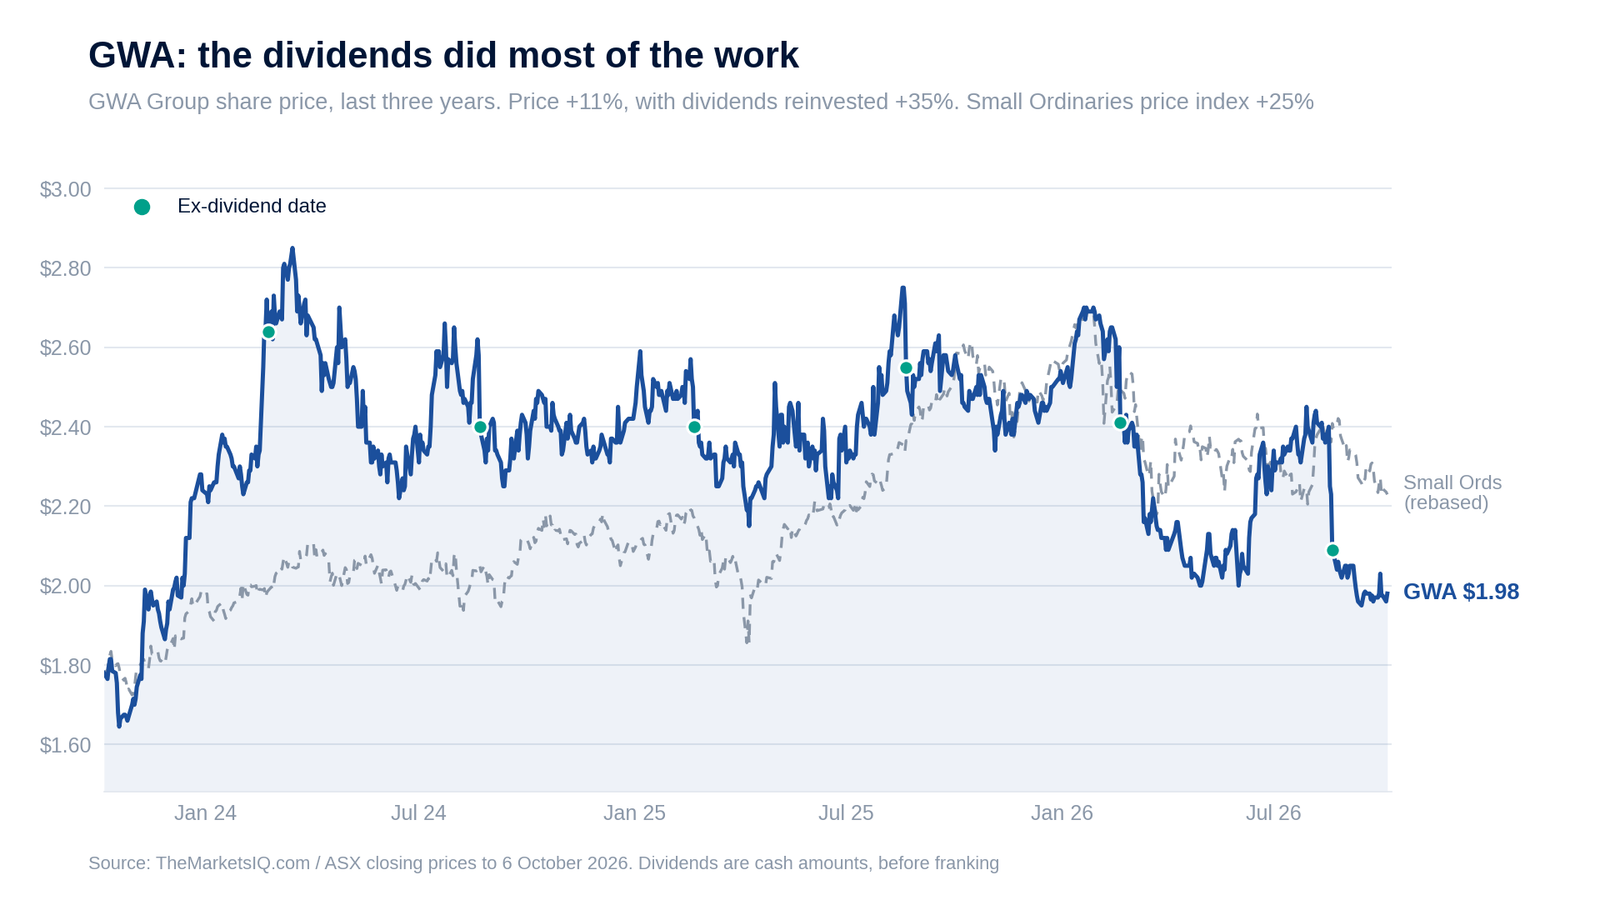
Over three years the share price has added 11%, while holders who reinvested the dividends are up 35%. Most of that return came from the cheques. The price has also fallen 27% from its January high of $2.70, which is a big part of why the yield now sits near 12%.
The next name makes its money from busy markets.
Bell Financial Group (ASX:BFG), The Broker That Doubled Its Earnings Per Share
Next catalyst: a full-year profit update, expected between mid-December and mid-January. Bell gave early reads on its full-year profit on 16 January 2025 and 10 December 2025, though it hasn’t done so every year. Full-year results usually follow in mid-February.
Bell Financial Group (ASX:BFG) is a stockbroker and wealth manager. You might know it through Bell Potter’s research or the Bell Direct trading platform.
Broking has a reputation as a feast-or-famine game. On 20 October 1987 the Australian market lost a quarter of its value in a single day, and broker profits went over the cliff with it.
Bell has spent years building a second engine so it doesn’t live and die by the tape. It’s working.
In the six months to June, revenue rose 36% to $165.6m. Net profit jumped 132% to $21.7m. Earnings per share went from 2.9 cents to 6.8 cents.
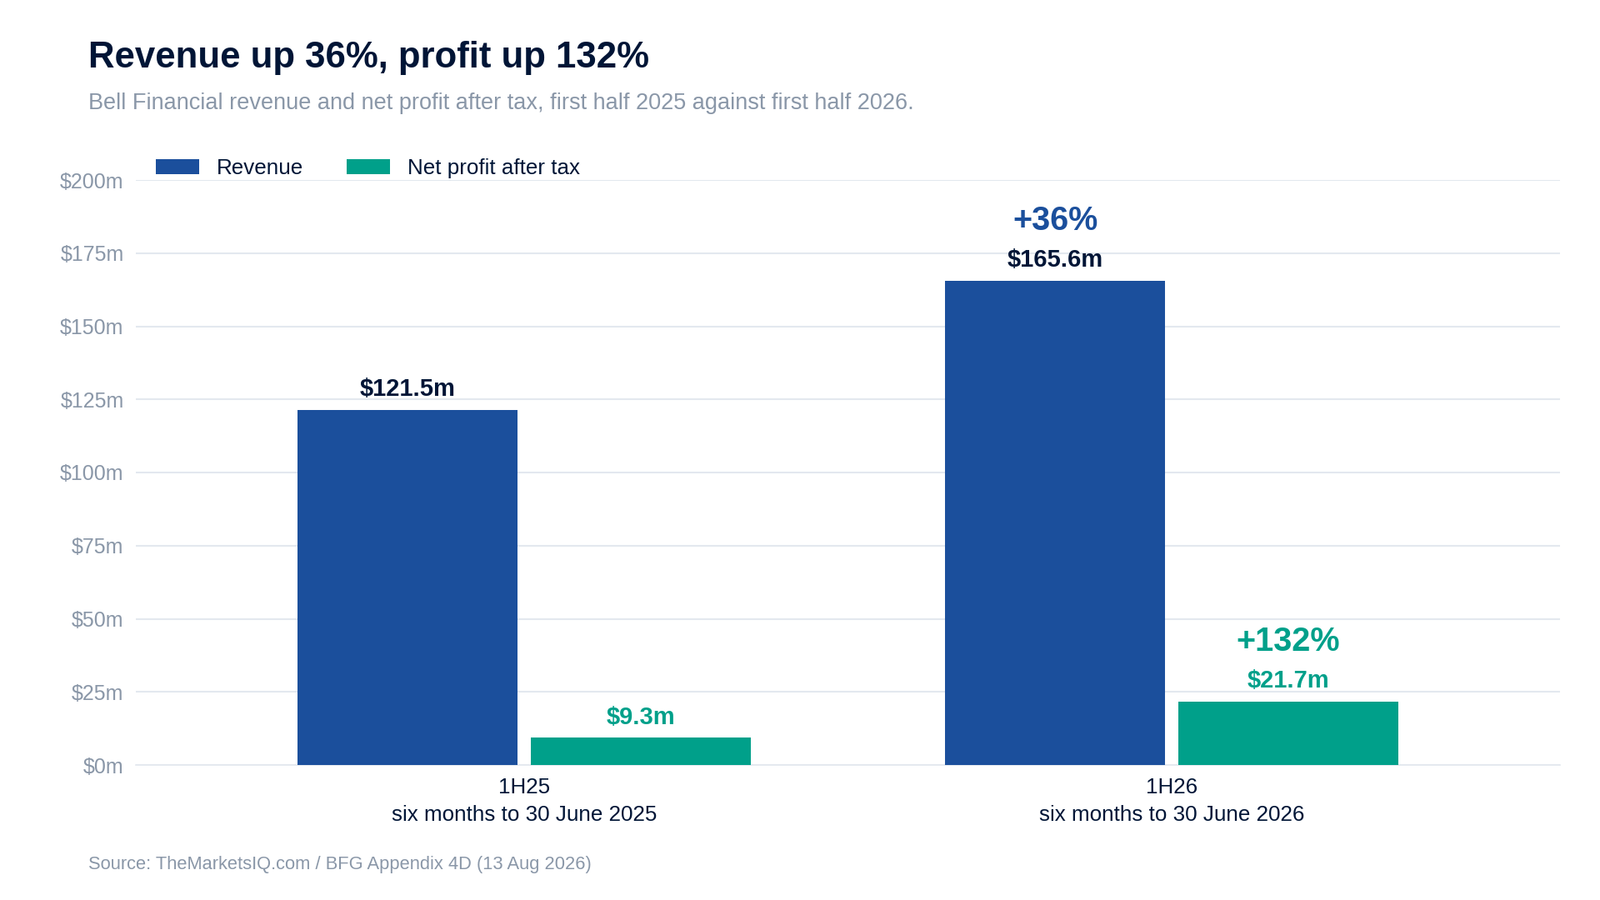
When profit grows almost four times faster than revenue, that’s operating leverage. The fixed costs are already paid, so each extra dollar of revenue falls to the bottom line.
Management doesn’t pretend it was all skill.
‘While strong markets helped drive our latest results, the diversification of our Markets and Platforms businesses is designed to support greater resiliency across a range of market conditions.’
Arnie Selvarajah, Bell Financial co-CEO
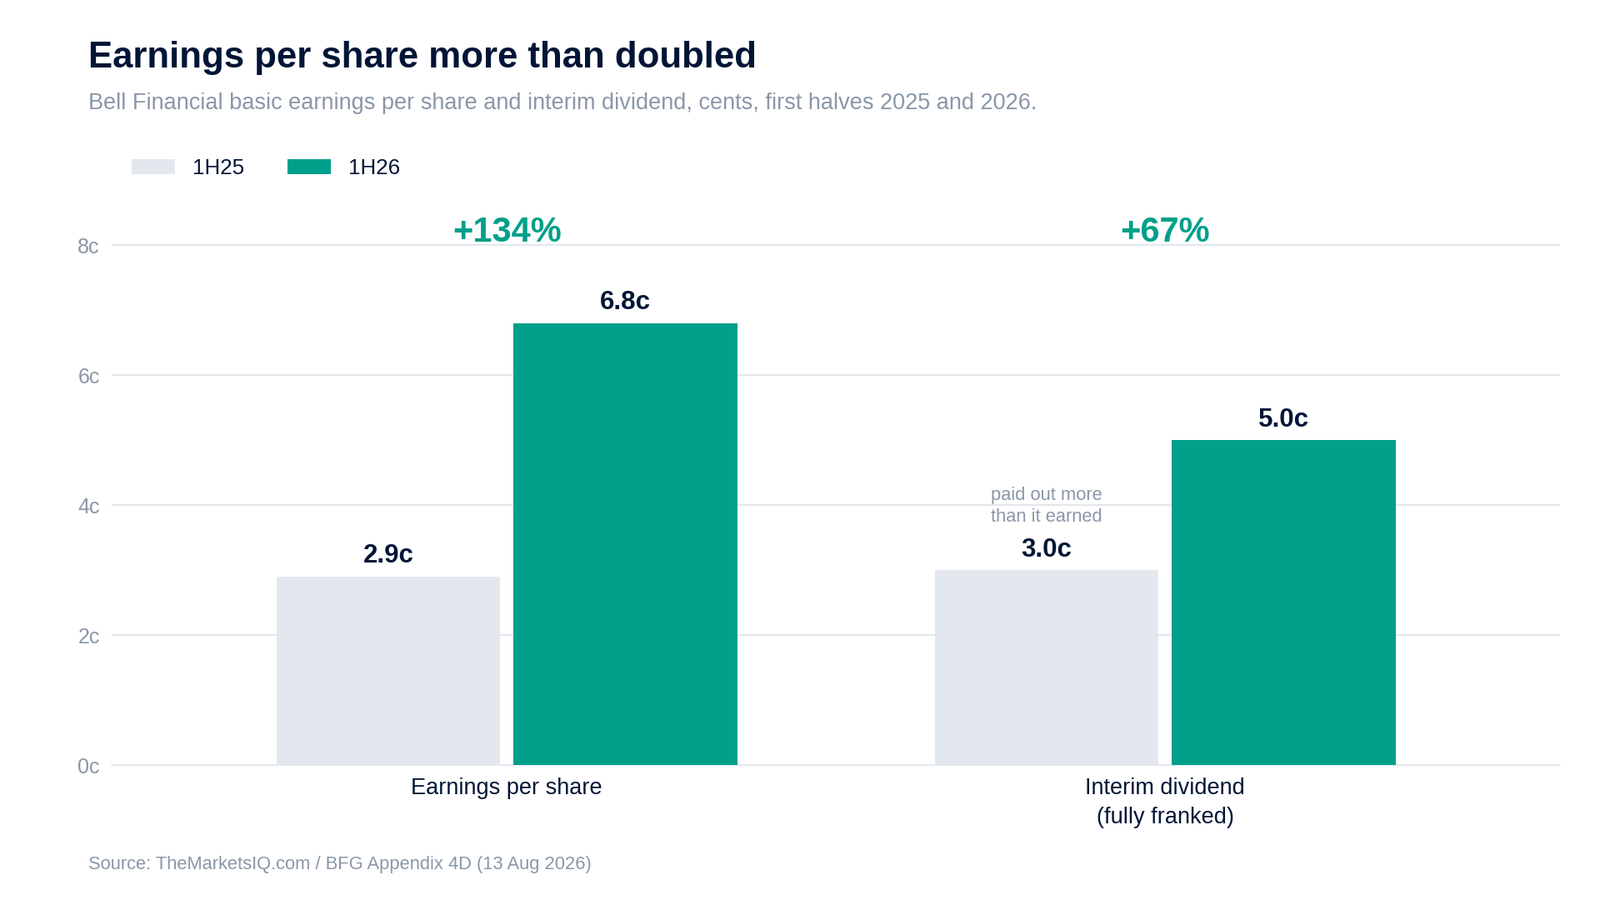
The board lifted the interim dividend from 3.0 cents to 5.0 cents, fully franked. A year ago it paid out more than it earned in the half. This time the dividend takes 74% of earnings, which leaves room.
Over the last 12 months, the 6.5-cent final paid in March plus the 5.0-cent interim paid in September comes to 11.5 cents. At $1.41 that’s an 8.2% cash yield, or 11.7% grossed up, on about 9.3 times trailing earnings.
The Second Half Usually Does The Heavy Lifting
Bell’s profit leans toward the back half of the year.
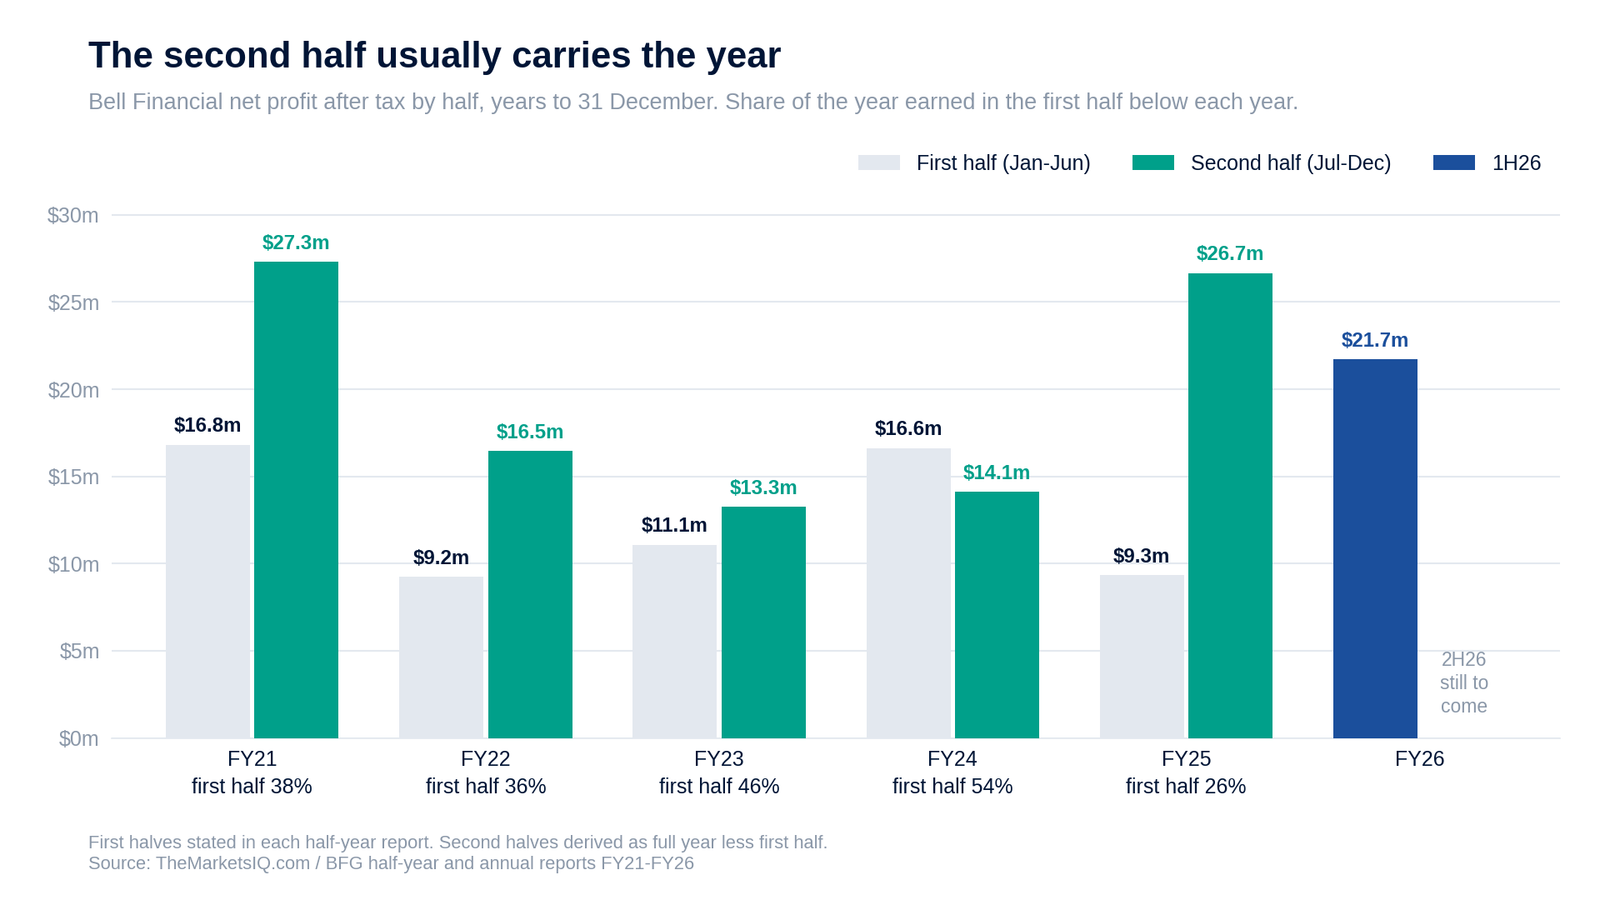
In four of the last five years, the second half earned more than the first. On average the January to June half has delivered just 40% of the year’s profit.
Management puts it down to market conditions. In 2025, it said, ‘the Group benefited from improved trading conditions and stronger equity markets momentum in the second half’. And FY24 broke the pattern, with 54% of profit landing in the first half.
So treat the history as a guide. If 2026 splits like the five-year average, the $21.7m first half points to full-year profit rising about 51% to $54.4m. At last year’s 84.6% payout ratio, that’s a dividend of about 14.3 cents, a 10.2% cash yield at $1.41.
If 2026 splits like FY24, profit rises about 12% to $40.2m. The dividend comes to about 10.6 cents, a 7.5% cash yield.
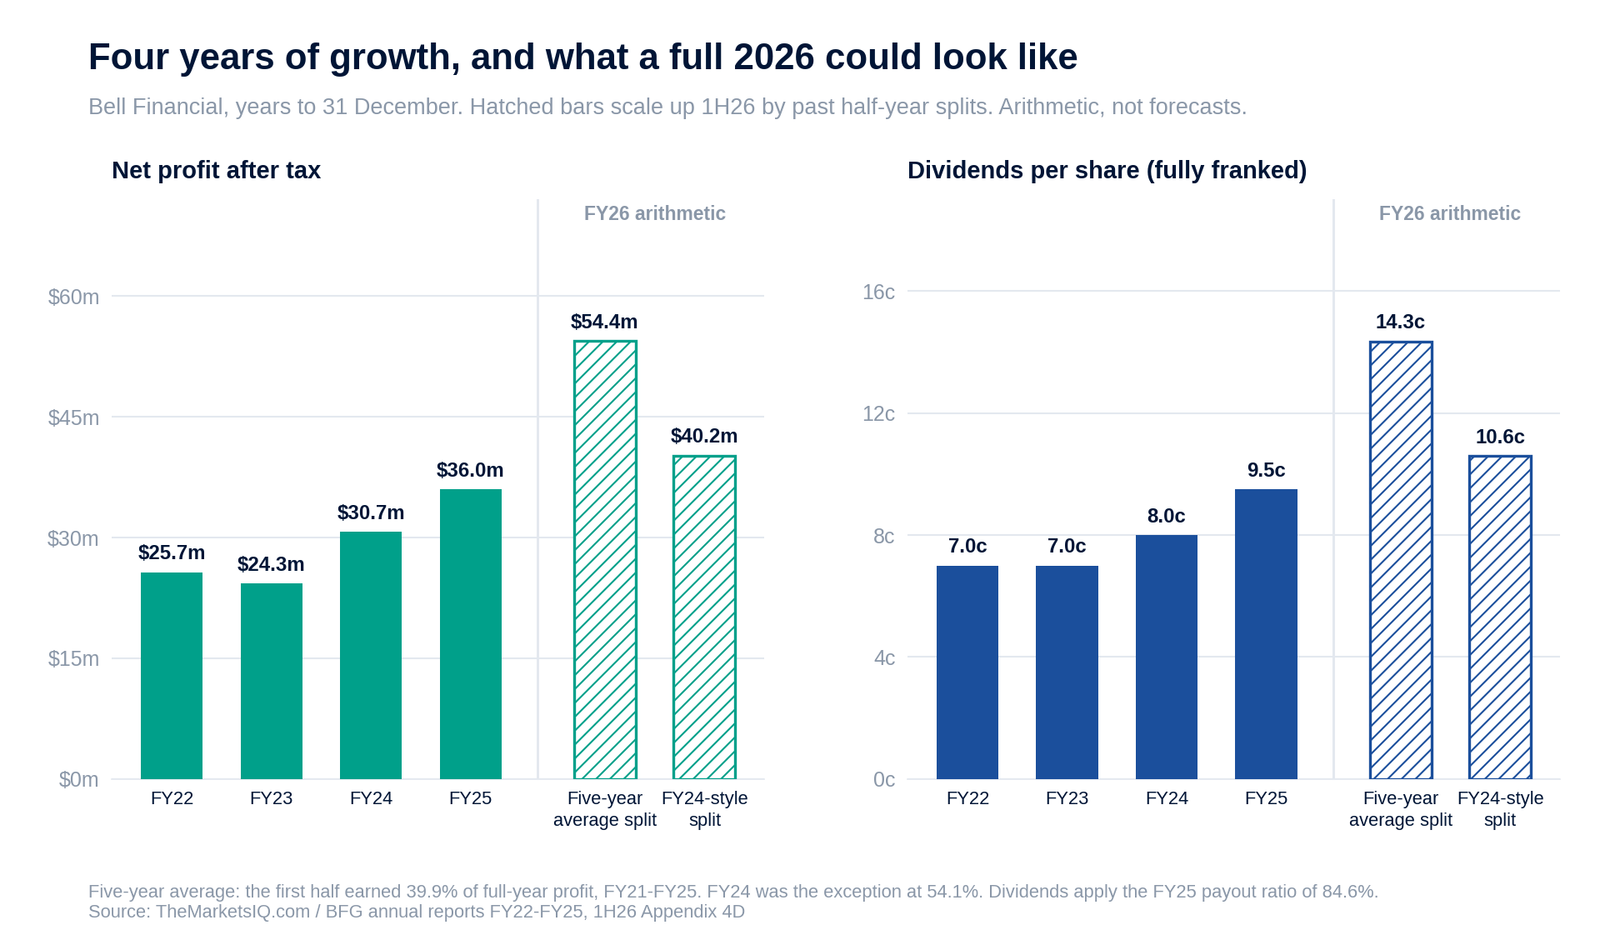
That’s arithmetic on Bell’s own history. It doesn’t come from management.
What The Market Data Says
Both cases need markets to stay busy. So far, they are.
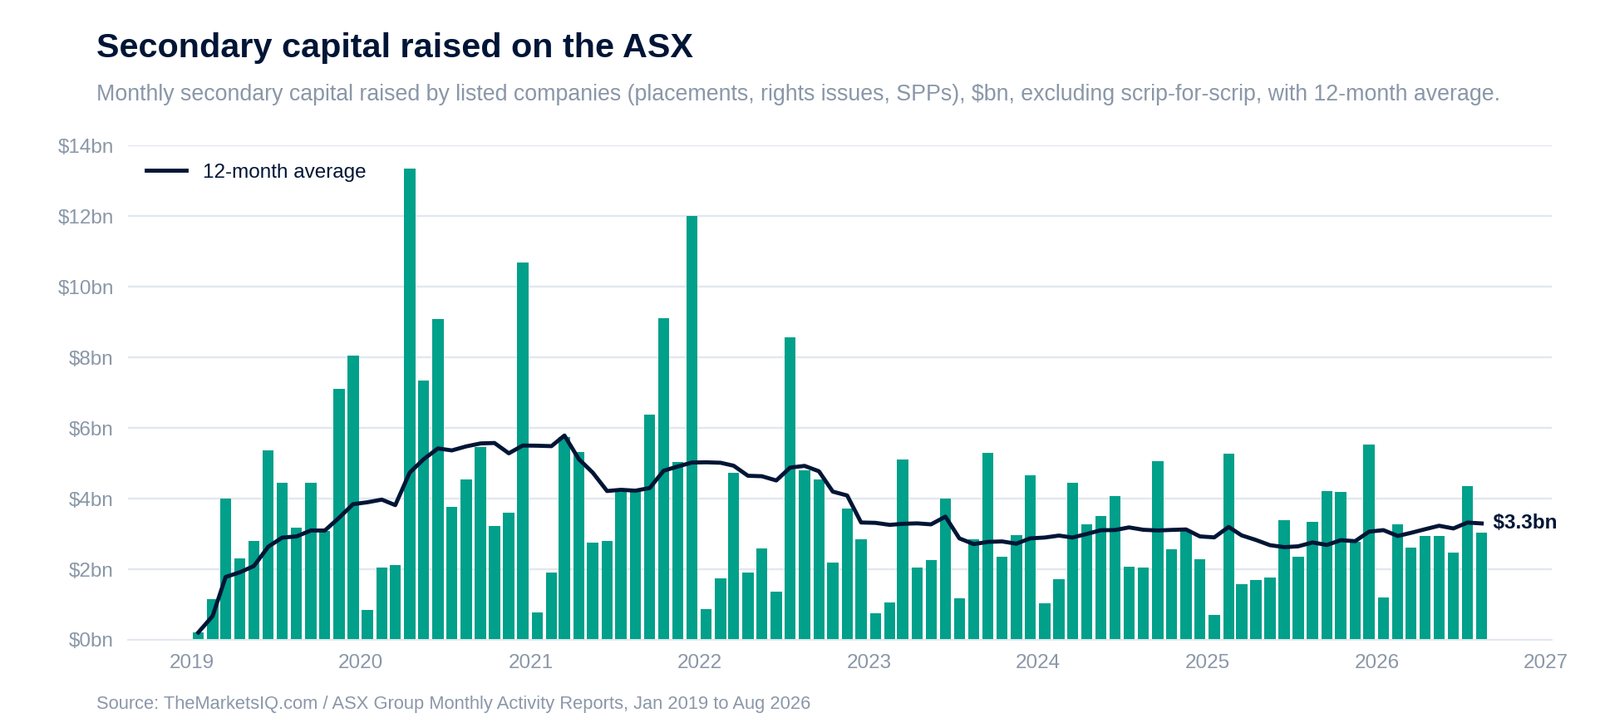
The ASX’s own figures show it. In the 12 months to August, listed companies raised $39.6bn through placements, rights issues and share purchase plans, up 20% on the year before. Every one of those raisings is a possible fee for a broker. On-market trading averaged $7.6bn a day, also up 20%.
Bell’s platforms business, which spans online broking, margin lending and the systems it runs for other brokers, produced 60.8% of half-year profit. And in May, co-CEO Dean Davenport said, ‘We have made a strong start to the year which is pleasing.’
One more signal. Director Andrew Bell bought 180,000 shares on market over four trading days between February and May, about $244,000 worth.
The Risk Management Is Flagging
Bell’s own outlook slide spells out the risk.
‘Australian and global markets remain exposed to geopolitical tensions, inflationary pressures and central bank policy decisions, which are likely to result in ongoing market volatility.’
Bell Financial 1H26 results presentation
For a broker, volatility cuts both ways. Busy markets fill the order book. A long, quiet slump empties it. Funds under advice already slipped 0.8% to $91.4 billion over the half.
And Bell is thinly traded, at about $230,000 of shares a day. Buying or selling in size can move the price.
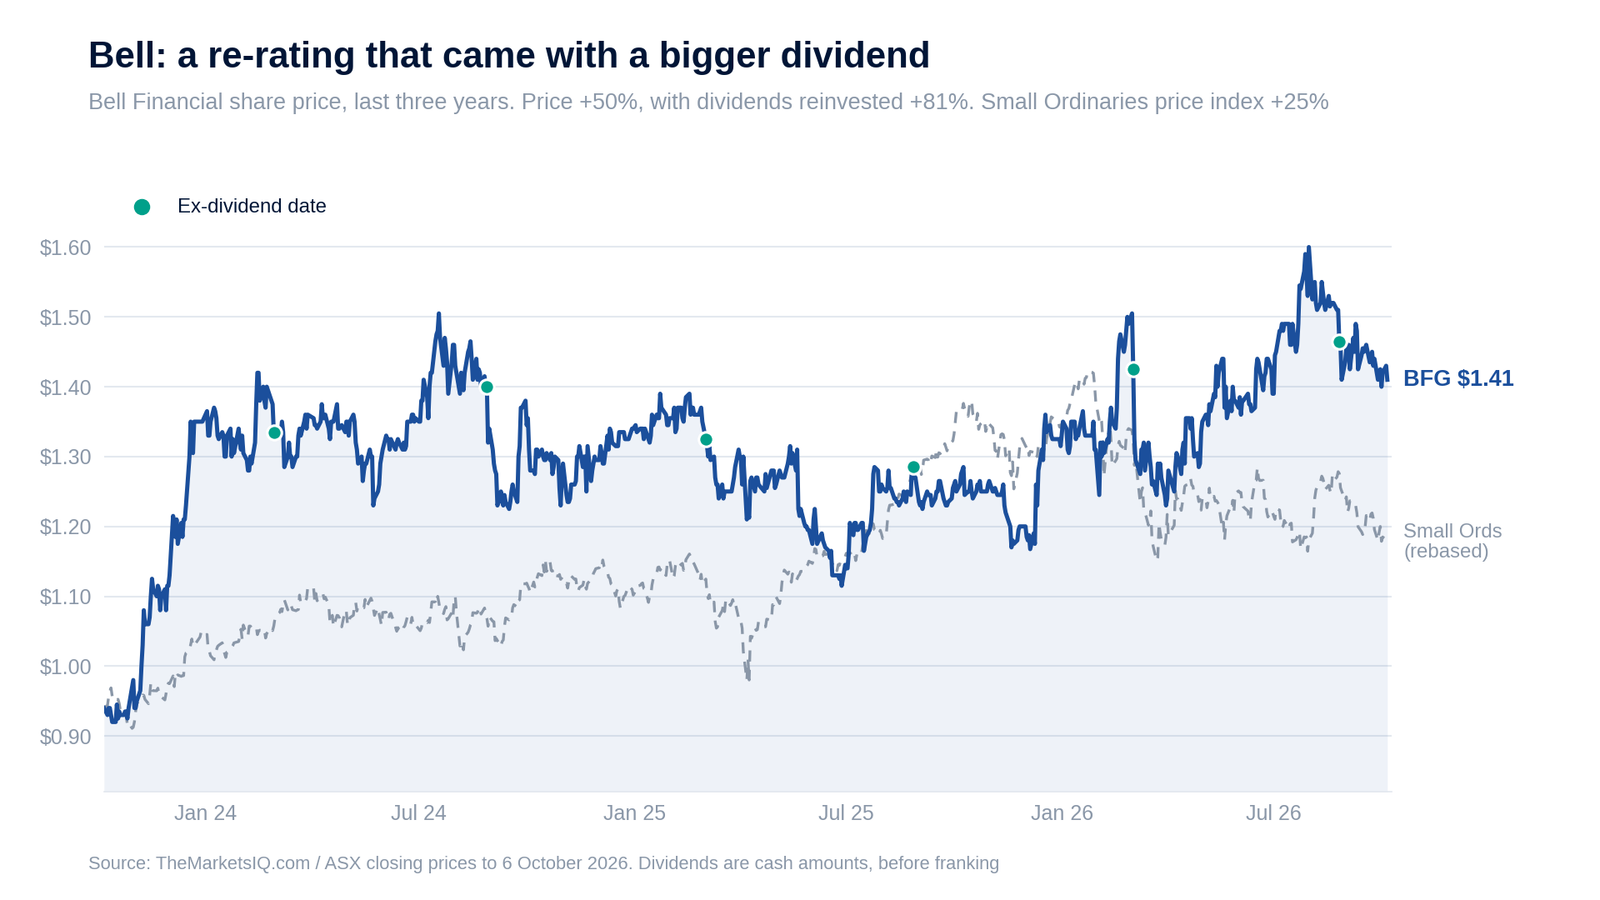
Bell’s price is up 50% in three years, and 81% with dividends reinvested, against 25% for the Small Ordinaries. It has given back 12% since peaking at $1.60 on 31 July.
The Week’s Edge
Two businesses. One job. They pay you to wait.
GWA put its prices up 5% in August, and its net margin has climbed from 8.6% to 11.4% in five years. Bell more than doubled its earnings per share and lifted its interim dividend 67%.
Neither is a bond proxy bleeding capital to fund its distribution. Both pay fully franked, and both yield 6-7% more than the 10-year bond once you count the franking.
Their engines differ. GWA needs its price rises to stick in a slow building market. Bell needs markets to stay busy.
So put two dates in your diary. GWA’s AGM is on 30 October. Bell’s profit update is expected between mid-December and mid-January.
Each will tell you whether the income is holding up.
Until next time, happy investing.
Izaac Ronay
Sign up to the Explosive Growth portfolio, and follow Izaac Ronay and The Markets IQ on LinkedIn.
Izaac Ronay is the Editor of The Markets IQ. He brings over 10 years of trading experience with top-tier global trading houses and 20 years of experience analysing and investing in ASX listed equities.
This publication has been prepared by The Markets IQ, a division of Vitti Capital Pty Ltd (ABN 13 670 030 145), which is a Corporate Authorised Representative (001306367) of Point Capital Group Pty Ltd (ABN 41 625 931 900), the holder of Australian Financial Services Licence 518031. This report is for general information only and does not take into account your objectives, financial situation, or needs. It is not personal financial advice or a recommendation to buy, hold, or sell any security. You should consider whether the information is appropriate in light of your circumstances and obtain professional advice before making any investment decision. This report is intended solely for wholesale, sophisticated, or professional investors within the meaning of the Corporations Act 2001 (Cth).
Any views, probabilities, valuations, technical levels, or forecasts expressed are strictly the opinions of the authors as at the date of publication, based on publicly available information and assumptions which may change without notice. They are illustrative only and not predictive of future outcomes. Past performance is not a reliable indicator of future performance.