

- January 15, 2026
Brace for Runaway Inflation
And the Data Point to Watch
This article is for general information only and is not personal financial advice.
By Izaac Ronay
The Investosphere is a constant cesspool of noise and misinformation.
Every day there’s a new hot take, a new chart, a new explanation for what just happened. Most of it is backward-looking. Most of it is flimsy. And almost all of it is trying to justify yesterday’s price action rather than prepare you for tomorrow’s risks.
That’s why the real edge in markets doesn’t come from reacting faster. It comes from identifying the big themes before they become obvious, and positioning early.
Right now, there is one risk the market is badly underestimating.
Inflation.
The market is expecting inflation to work the way it has since the post-pandemic peak. Not in the way it worked in the 1970s and 1980s. That’s a period of very high inflation, peaking above 17% in the mid 1970s. Short-term interest rates exceeded 20% in Australia, with standard mortgage interest rates peaking above 17%.
You might think that sounds impossible today. Well people thought that in the early 1970s as well.
We’ll discuss the potential implications for runaway inflation, and the reasons for thinking it’s possible.
We successfully called the end of interest rate cuts when the market was being too optimistic back in May 2025.
But that was a very straightforward market mispricing and a misunderstanding of how the RBA works.
Our call today is far less obvious. Far less certain. If I had to put a probability on this playing out, I’d say 20-30% chance.
So, why keep reading?
Because if this scenario does play out, reading this article may well save your portfolio from complete ruin. It may even allow you to achieve some impressive gains if you play it right.
Energy Prices, the Structural Inflation
One of the greatest drivers of inflation is energy prices.
It makes sense when you stop to think about it. Energy is a cost input to every good that moves from one place to another. It impacts continually along production and supply chains of both goods and services.
In the 1970s there was a series of energy price shocks that contributed to a strong inflation.
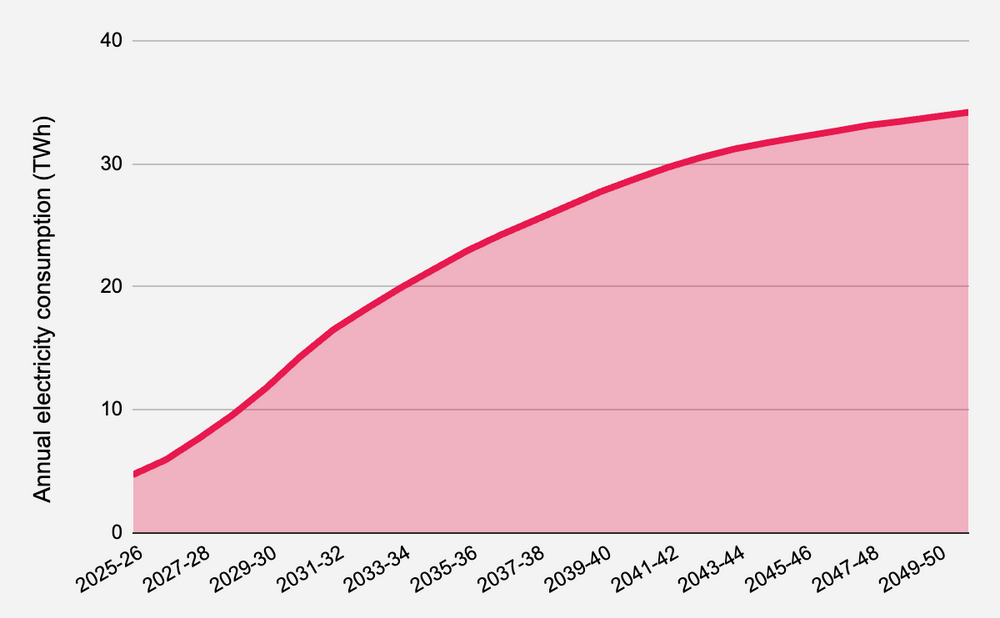
Over the next couple of decades we’re looking at a completely different beast. The rise of artificial intelligence is creating a need for much more data storage and processing.
Estimates have the global data centre market at double to triple its current size by 2030.
The thing about data centres is they’re massive energy consumers. So much so, that we’re facing a potential energy crisis from data centres alone.
It’s an issue getting not nearly enough air-time right now. We could write a book on that topic, but we’ll leave that to another day.
In Australia, data centre energy consumption is expected to increase 5-fold over the next decade.
Typical data centres can use as much energy as all the houses in a suburb. A large-scale data centre can approach small city levels of energy usage.
All of that energy demand could have big implications for energy prices.
Inflationary implications.
If demand outstrips supply, we could see energy prices through the roof.
The Money Multiplier, the Loaded Inflation Gun
If you’re wise enough with a decent memory, you might recall the Quantitative Easing (QE) program introduced after the Global Financial Crisis in 2008.
It was a massive money printing campaign, used to support global asset prices with an enormous bond-buying program in many countries, eventually spilling into equities and other riskier products.
There were also some currency and yield curve manipulation strategies used, such as Operation Twist in the US. During peak Covid-mania, the RBA introduced a 10 basis-point price floor on the Australian 3-year government bond.
Many commentators expected massive inflation. There were calls for gold to hit a bazillion dollars and for currency to become worthless.
But outside of countries like Venezuela and Iran, inflation was dead.
Inflation stayed low because of how the banking system responded, along with a few regulatory reforms.
The easiest way to demonstrate the shift in behaviour is with the Money Multiplier.
In very, VERY simple terms you might think of the Money Multiplier as the ratio of lent and borrowed money (M2) to central bank base money (M0).
When central banks print and destroy money, and set interest rates, they’re using a very blunt instrument to try to coerce commercial banks to lend more or less, and also for borrowers to borrow more or less.
When the central banks were creating all of that extra base money (M0) and using it to buy assets, a funny thing was happening. Commercial banks were seeing their balance sheets strengthen, but they weren’t really lending that money out.
So while the total amount of money in circulation stayed strong, it was basically the commercial bank created money being replaced by central bank money.
So, the Money Multiplier fell off a cliff.
The following chart shows it nicely.
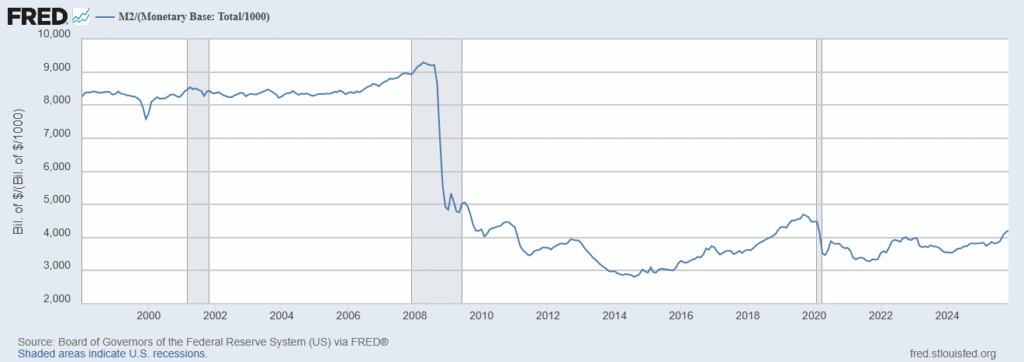
This is why the massive QE programs of the 2010s inflated asset prices but did not generate sustained consumer price inflation. The transmission mechanism into wages and broad demand never fully engaged.
Today, that dynamic has created a very different risk.
The economic system is walking around with this loaded gun, a lending system with a lot of excess capacity. That means there’s heaps of room for lending to increase dramatically with the current base money supply.
But lucky for us, there have been some further restrictions and belt-tightening put in place. The only way lending could get out of control is if…well bankers were somehow greedy…
But, in all seriousness, it wouldn’t take much of a shift in incentives and regulatory workarounds for humanity’s worst self to re-emerge in the banking sector.
Why Inflation is a Self-Reinforcing Cycle
Inflation works kind of the same way as toilet paper shortages. We’re all still bearing the scars of Covid-induced panic buying, so let’s kill two birds with one stone by dredging up those traumatic memories.
Think of this as a mini counselling session.
Do you remember when Covid was kicking off and you went to the shops to stock up on some extra canned foods and maybe your last chance at fresh fruit and vegetables for an undetermined period of months or years?
You were casual, composed, just grabbing a few extra items, nothing crazy.
Then you glanced down the toilet paper aisle.
And you saw Lord of the Flies in real time. The aisle was on fire. No toilet paper in sight. Just the leftover wounds of trench warfare.
You hadn’t needed toilet paper when you arrived, and suddenly it was the ONLY thing you needed. You had to have it. It was PRECIOUS. The need for toilet paper became a hunger that could not be satiated. A primal need.
It was Salem witch trials. The Inquisition. Stalin’s purges.
It all made sense at the time.
But in the aftermath, when the dust had settled, you couldn’t find a single soul who would admit to having bought toilet paper during those crazy times. The shame of giving in to the mania was too great to admit.
It was the ‘others’. Always the ‘others’.
Inflation is kind of like that. Once it gets started, it takes on a life of its own.
Prices go up, and people expect prices to keep going up, so they start demanding higher salaries. Producers see energy and fertiliser costs increasing so they increase their prices even more.
Shops increase margins to account for the inflation that will continue to eat away at it. Those costs feed into each other and keep pushing things in the same direction.
That’s why runaway inflation is incredibly difficult to stop.
Wages, Housing, Gold and Runaway Inflation
We’ve seen assets like gold and houses take off already. There are plenty of people still thinking these have to crash back down to reality.
But this is almost certainly not how the correct balance will be restored. Instead, we’re likely to see the prices of other goods play catch up.
But more than goods and services, the thing that could lead to massive inflation is wage costs. This is the area that really needs to catch up. And we’re starting to see some traction on that front now.
So don’t expect house prices to fall. Along with precious metals, we might have only seen the start of the house price bull market. A look back at the 1970s shows what’s possible.
The following chart shows the gold price move during that time.
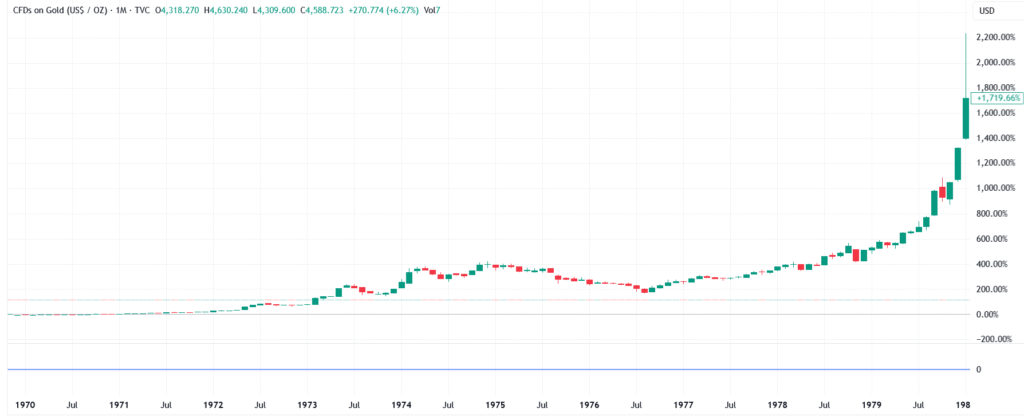
Take this data with a grain of salt, since gold was only decoupled from the USD during this time. Still, silver behaved in a similar fashion.
The high in this chart marked the high for a while, before the next big bull run.
The next key to the inflation game to get traction is for wages to start increasing. Wages, like energy, feed into the prices of every good and service in the marketplace. This is where we’ll truly see the next wave of massive inflation created, if our thesis is correct.
In the second half of 2025, wage price inflation had largely caught up with CPI for the first time in several years.
Watch for signs that wage inflation continues to gain momentum. This is one of the key data points to watch out for.
The very critical thing about wages increasing is that there are generally two criteria for lending, particularly in the housing market. The first is equity. Banks want borrowers to have some skin in the game. Typically they want a 20% deposit, but we know that that can be stretched to extremes. They’ll lend 100% under the right conditions.
With house prices continuing to rampage, anyone who’s held a home for a few years is likely equity rich.
So that’s not stopping a tidal wave of lending.
The other thing that banks look for is serviceability. That’s your ability to make the repayments. As incomes increase above the cost of living, serviceability increases.
That’s the giant key to unlocking the next wave in house price growth in particular. But it will also flow through into other assets.
The Edge
Runaway inflation might sound like a scary prospect. It can certainly be a rollercoaster ride. But it can also be a great wealth building period. In times of high inflation, we can expect interest rates to rise dramatically.
Even if the unemployment rate is up, we know from previous inflationary times that central banks will prioritise breaking inflation over keeping everyone employed.
So, locking in debt at low interest rates can be extremely powerful. Asset prices can rise dramatically in these environments. Much more so than what we’ve already seen in Australian house prices.
Companies with strong pricing power do well in these environments. Think the supermarkets, utilities, healthcare stocks and insurers.
Precious metals could have much further to run. Importantly, junior miners in gold and silver are yet to be priced fully for the new price environment. Copper has a strong potential to outperform, with heavy exposure to demand for data centres and continued electrification.
Spotting mispriced growth opportunities is what we're all about at The Markets IQ. If you want to stay ahead of the curve, subscribe to our newsletter and follow Vitti Capital on LinkedIn.
Until next time, happy investing.
Izaac Ronay
Izaac is a broker and trader with Vitti Capital. He brings over 10 years of trading experience with top tier global trading houses and 20 years of experience analysing and investing in ASX listed equities.
This publication has been prepared by The Markets IQ, a division of Vitti Capital Pty Ltd (ABN 13 670 030 145), which is a Corporate Authorised Representative (001306367) of Point Capital Group Pty Ltd (ABN 41 625 931 900), the holder of Australian Financial Services Licence 518031. This report is for general information only and does not take into account your objectives, financial situation, or needs. It is not personal financial advice or a recommendation to buy, hold, or sell any security. You should consider whether the information is appropriate in light of your circumstances and obtain professional advice before making any investment decision. This report is intended solely for wholesale, sophisticated, or professional investors within the meaning of the Corporations Act 2001 (Cth).
Any views, probabilities, valuations, technical levels, or forecasts expressed are strictly the opinions of the authors as at the date of publication, based on publicly available information and assumptions which may change without notice. They are illustrative only and not predictive of future outcomes. Past performance is not a reliable indicator of future performance.